Evidently Tutorial: From pip to Production Monitoring in 15 Minutes
Step-by-step tutorial for Evidently — install via pip, run LLM evaluations with descriptors, detect data drift in tabular data, and deploy the self-hosted Monitoring UI with Docker.

Getting Started with Evidently — From pip to Production Monitoring in 15 Minutes
I remember my first attempt at model monitoring. I had a drift detection script, a Slack webhook, and a spreadsheet where I manually logged alerts. It was fragile, it was ugly, and it broke every other week.
Evidently changes that. Let me walk you through setting it up — first as a Python library for quick evals, then as a self-hosted monitoring service with Docker. This will take about 15 minutes.
🚀 Want to deploy Evidently yourself?
Docker configs, system requirements, and installation guides — all on one page.
View Evidently Tool Page →Step 1: Install Evidently
The simplest way is pip:
pip install evidentlyIf you prefer Conda:
conda install -c conda-forge evidently⚠️ What tripped me up: I installed it in my global Python environment and ran into dependency conflicts with my existing ML stack. Use a virtual environment! I wasted 20 minutes debugging numpy version mismatches.
Step 2: Run Your First LLM Evaluation
Let's evaluate a simple Q&A dataset. This is the "Hello World" of Evidently's LLM evaluation:
import pandas as pd
from evidently import Report, Dataset, DataDefinition
from evidently.descriptors import Sentiment, TextLength, Contains
from evidently.presets import TextEvals

# Create a toy dataset
eval_df = pd.DataFrame([
    ["What is the capital of Japan?", "The capital of Japan is Tokyo."],
    ["Who painted the Mona Lisa?", "Leonardo da Vinci."],
    ["Can you write an essay?", "I'm sorry, but I can't assist with homework."]
], columns=["question", "answer"])

# Add descriptors (row-level evaluators)
eval_dataset = Dataset.from_pandas(
    pd.DataFrame(eval_df),
    data_definition=DataDefinition(),
    descriptors=[
        Sentiment("answer", alias="Sentiment"),
        TextLength("answer", alias="Length"),
        Contains("answer", items=['sorry', 'apologize'], mode="any", alias="Denials")
    ]
)

# Run the report
report = Report([TextEvals()])
my_eval = report.run(eval_dataset)
my_eval
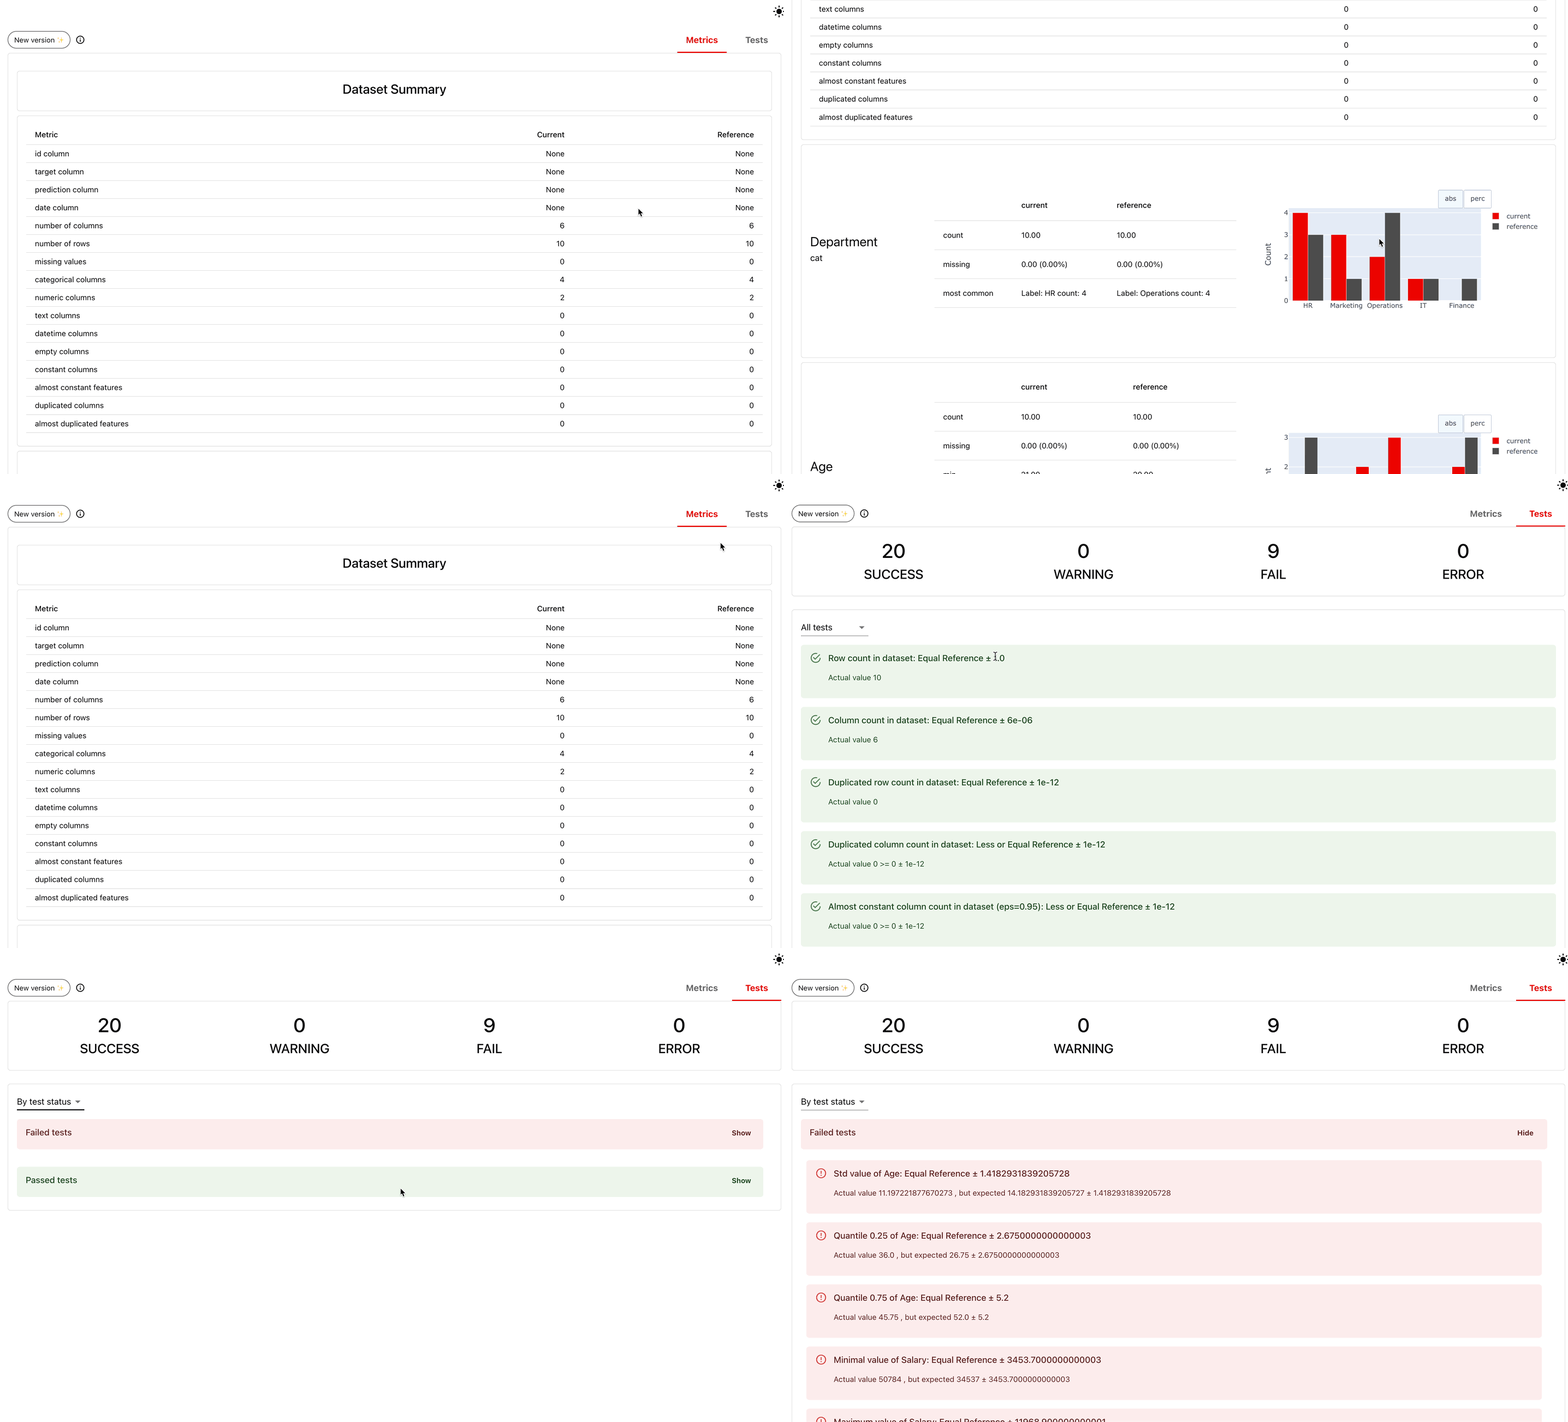
If you see a summary with sentiment distribution and text length stats — it worked. If not, check that your pandas version is >= 1.3.0.
Step 3: Data Drift Detection (Tabular)
Evidently really shines with tabular data drift. Let's use the classic Iris dataset:
from sklearn import datasets
from evidently.presets import DataDriftPreset

iris_data = datasets.load_iris(as_frame=True)
iris_frame = iris_data.frame

report = Report([DataDriftPreset(method="psi")])
my_eval = report.run(iris_frame.iloc[:60], iris_frame.iloc[60:])
my_eval.save_html("drift_report.html")
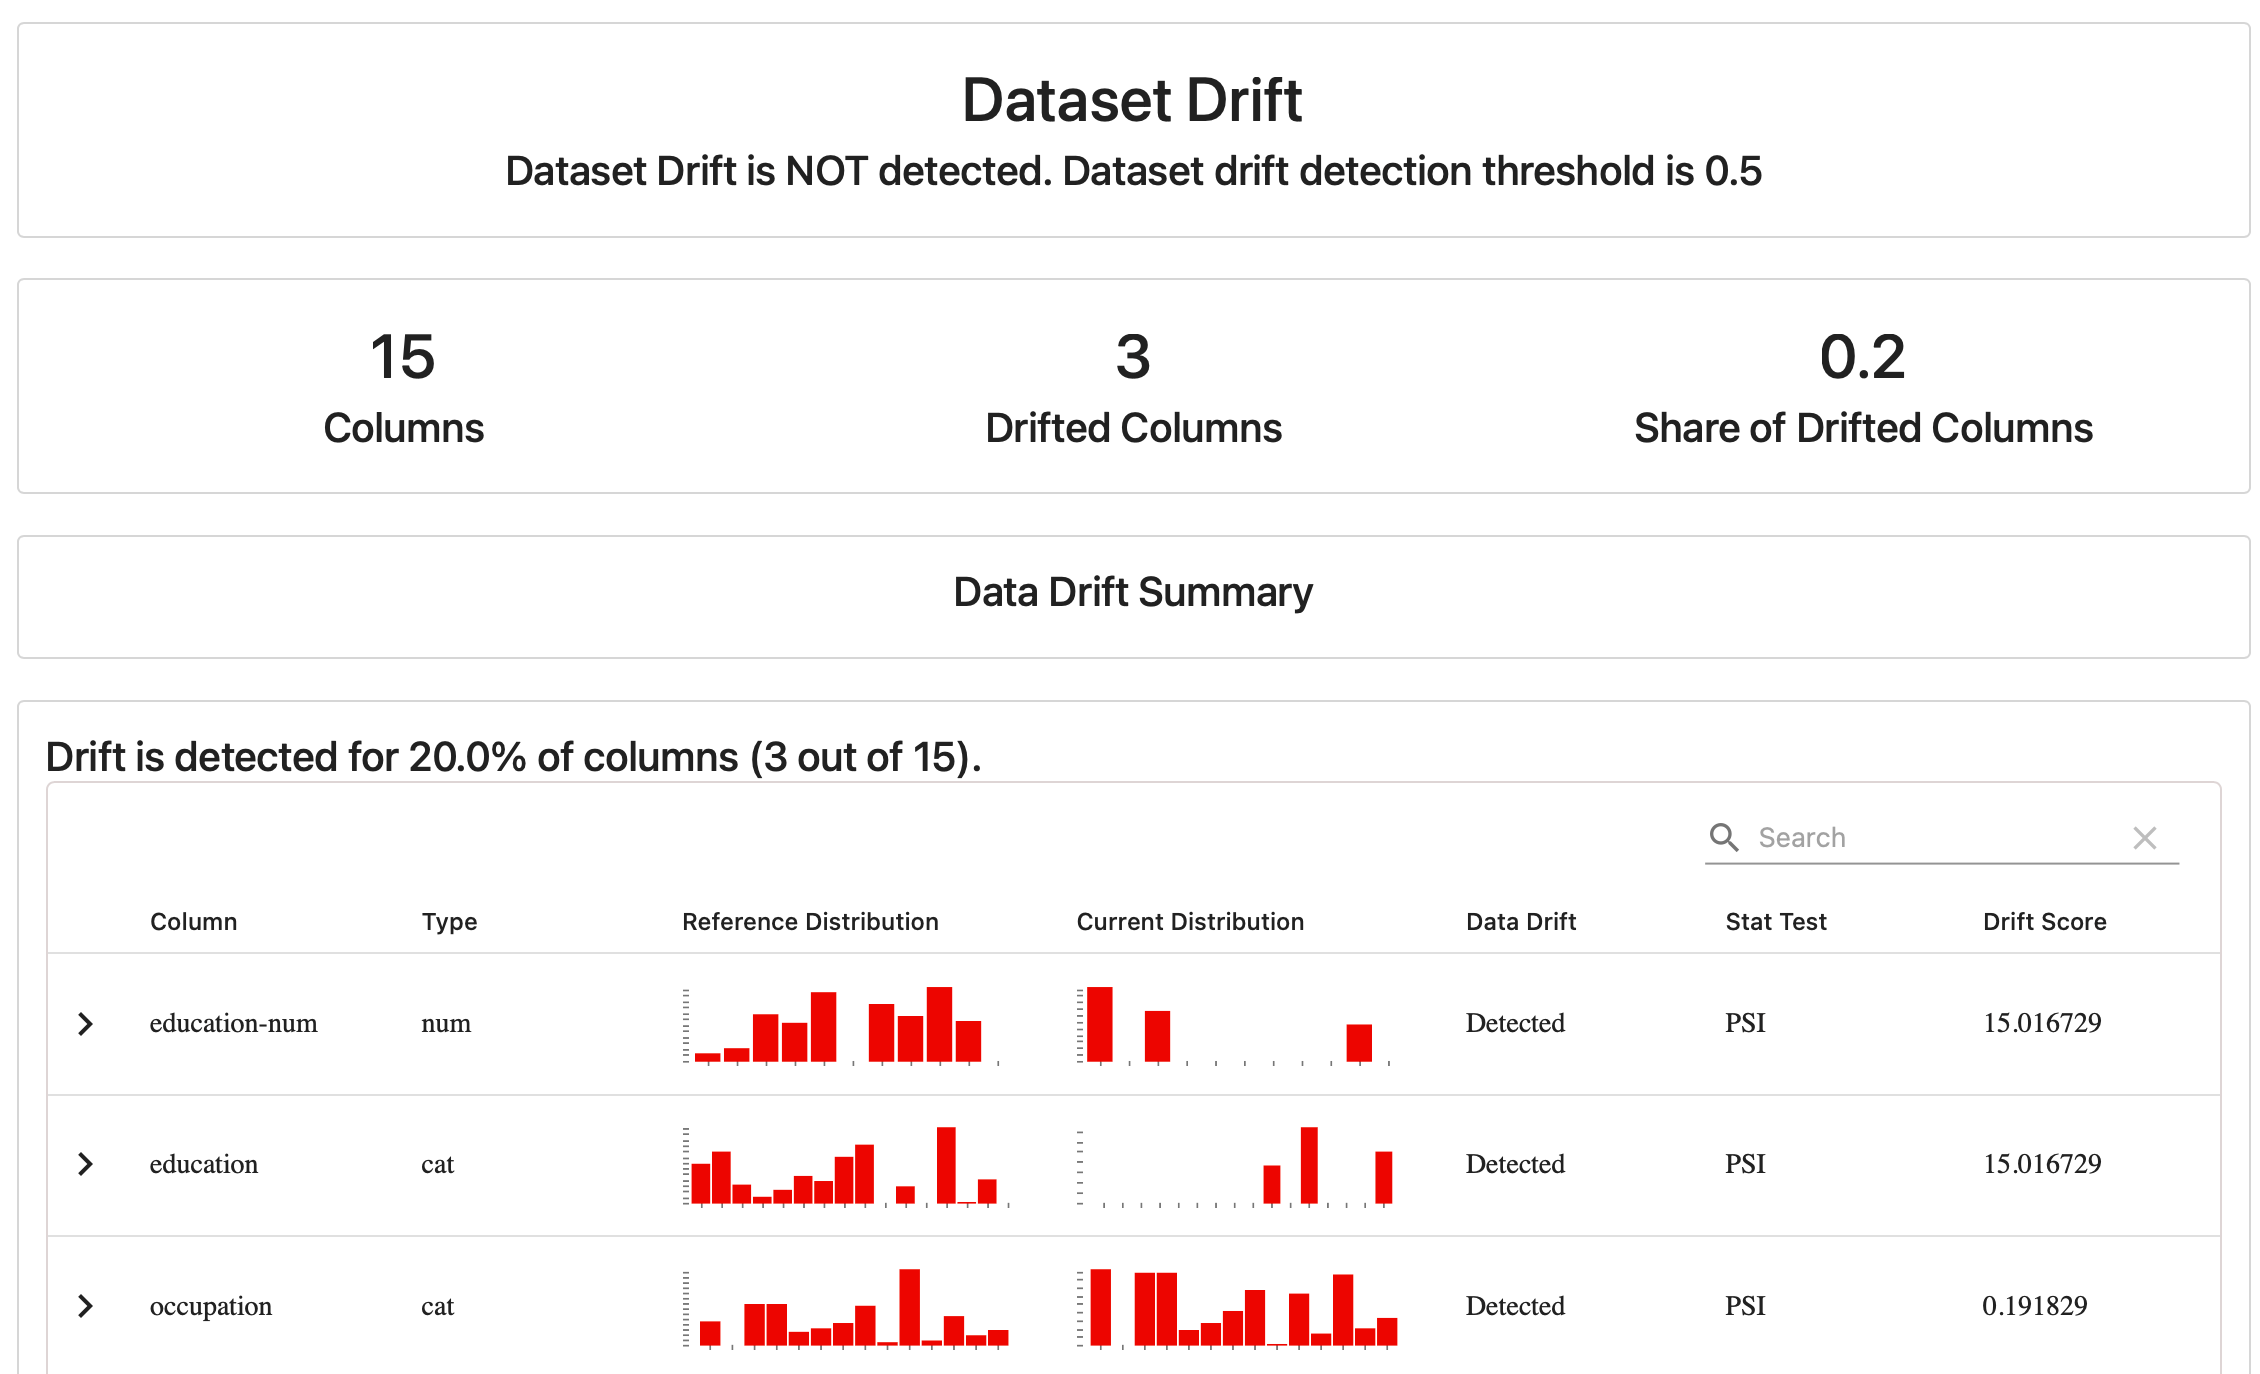
Open drift_report.html in your browser. You'll see per-column drift scores with visualizations. The PSI method (Population Stability Index) is a good default for tabular data, but you can also use KS-test or Jensen-Shannon divergence.
Step 4: Self-Host the Monitoring UI with Docker
Now for the production monitoring setup. This is where Evidently becomes a proper observability platform:
# Create a directory for Evidently data
mkdir -p ~/evidently-data

# Run the Evidently service
docker run -d \
  --name evidently \
  -p 8080:8080 \
  -v ~/evidently-data:/data \
  --restart unless-stopped \
  evidently/evidently-service:latest
Wait about 30 seconds for the service to start. Then open http://localhost:8080 in your browser.
If you see the Evidently UI login screen — 🎉 congratulations, it's running. If not, check docker logs evidently to see what happened.
Step 5: Connect Your Pipeline
To send data to the monitoring UI from your Python pipeline, use the EvidentlyService:
from evidently.ui.workspace import Workspace

# Connect to the local service
ws = Workspace("http://localhost:8080")

# Create a project
project = ws.create_project("My Model")

# Send a report
report = Report([DataDriftPreset()])
report.run(reference_data, current_data)
ws.add_report(project.id, report)
Comparison with alternatives: I've used MLflow for experiment tracking and WhyLogs for data profiling. Evidently sits in a different spot — it's specifically for ongoing monitoring with pass/fail conditions, not just logging. If you need a lightweight way to catch drift before it affects users, Evidently wins. If you need full MLOps with model registry and deployment, pair it with MLflow.
Things That Tripped Me Up
- Port conflicts: I had something running on 8080 already. Changed to
-p 8081:8080and updated my workspace URL. - Data directory permissions: The Docker container runs as a non-root user. Make sure
~/evidently-datais writable (chmod 777in a pinch, but better to match the container's UID). - Missing descriptors: If you pass a descriptor that references a column name that doesn't exist, Evidently throws a cryptic error. Double-check your column names match between the dataset and the descriptor aliases.
Conclusion — When Should You Use This?
Evidently is perfect for teams that already have ML models in production and need to know "is this still working?" without building a monitoring system from scratch. It's especially good if you're running LLM applications alongside traditional ML — you get one consistent interface for both.
It's not for you if you need a fully managed SaaS solution (try Evidently Cloud instead), or if your stack is entirely non-Python.
Bottom line: pip install and 15 minutes gets you from zero to a working monitoring setup. That's hard to beat.
🚀 Explore Evidently on Run This Ai
Docker Compose configs, system requirements, installation guides, and more — all in one place.
View Evidently Tool Page →