HyperDX Review: Unified Observability with Session Replays, Logs, and Traces
A hands-on review of HyperDX — the open-source alternative to Datadog that combines session replays, logs, traces, metrics, and errors in one platform.
🚀 Want to deploy HyperDX yourself?
Docker configs, system requirements, and installation guides — all on one page.
View HyperDX Tool Page →After spending years wrangling separate tools for logs, metrics, traces, and errors, I put HyperDX through its paces to see if it truly delivers on the promise of unified observability. Here's my honest review after hands-on testing.
First Impressions
Getting HyperDX running took less than 2 minutes — one Docker command and the full stack was up. The UI greeted me with a clean, modern dashboard that immediately felt familiar. Unlike the overwhelming noise of Grafana dashboards or the rigid structure of Datadog, HyperDX's interface is refreshingly straightforward.
Search Performance
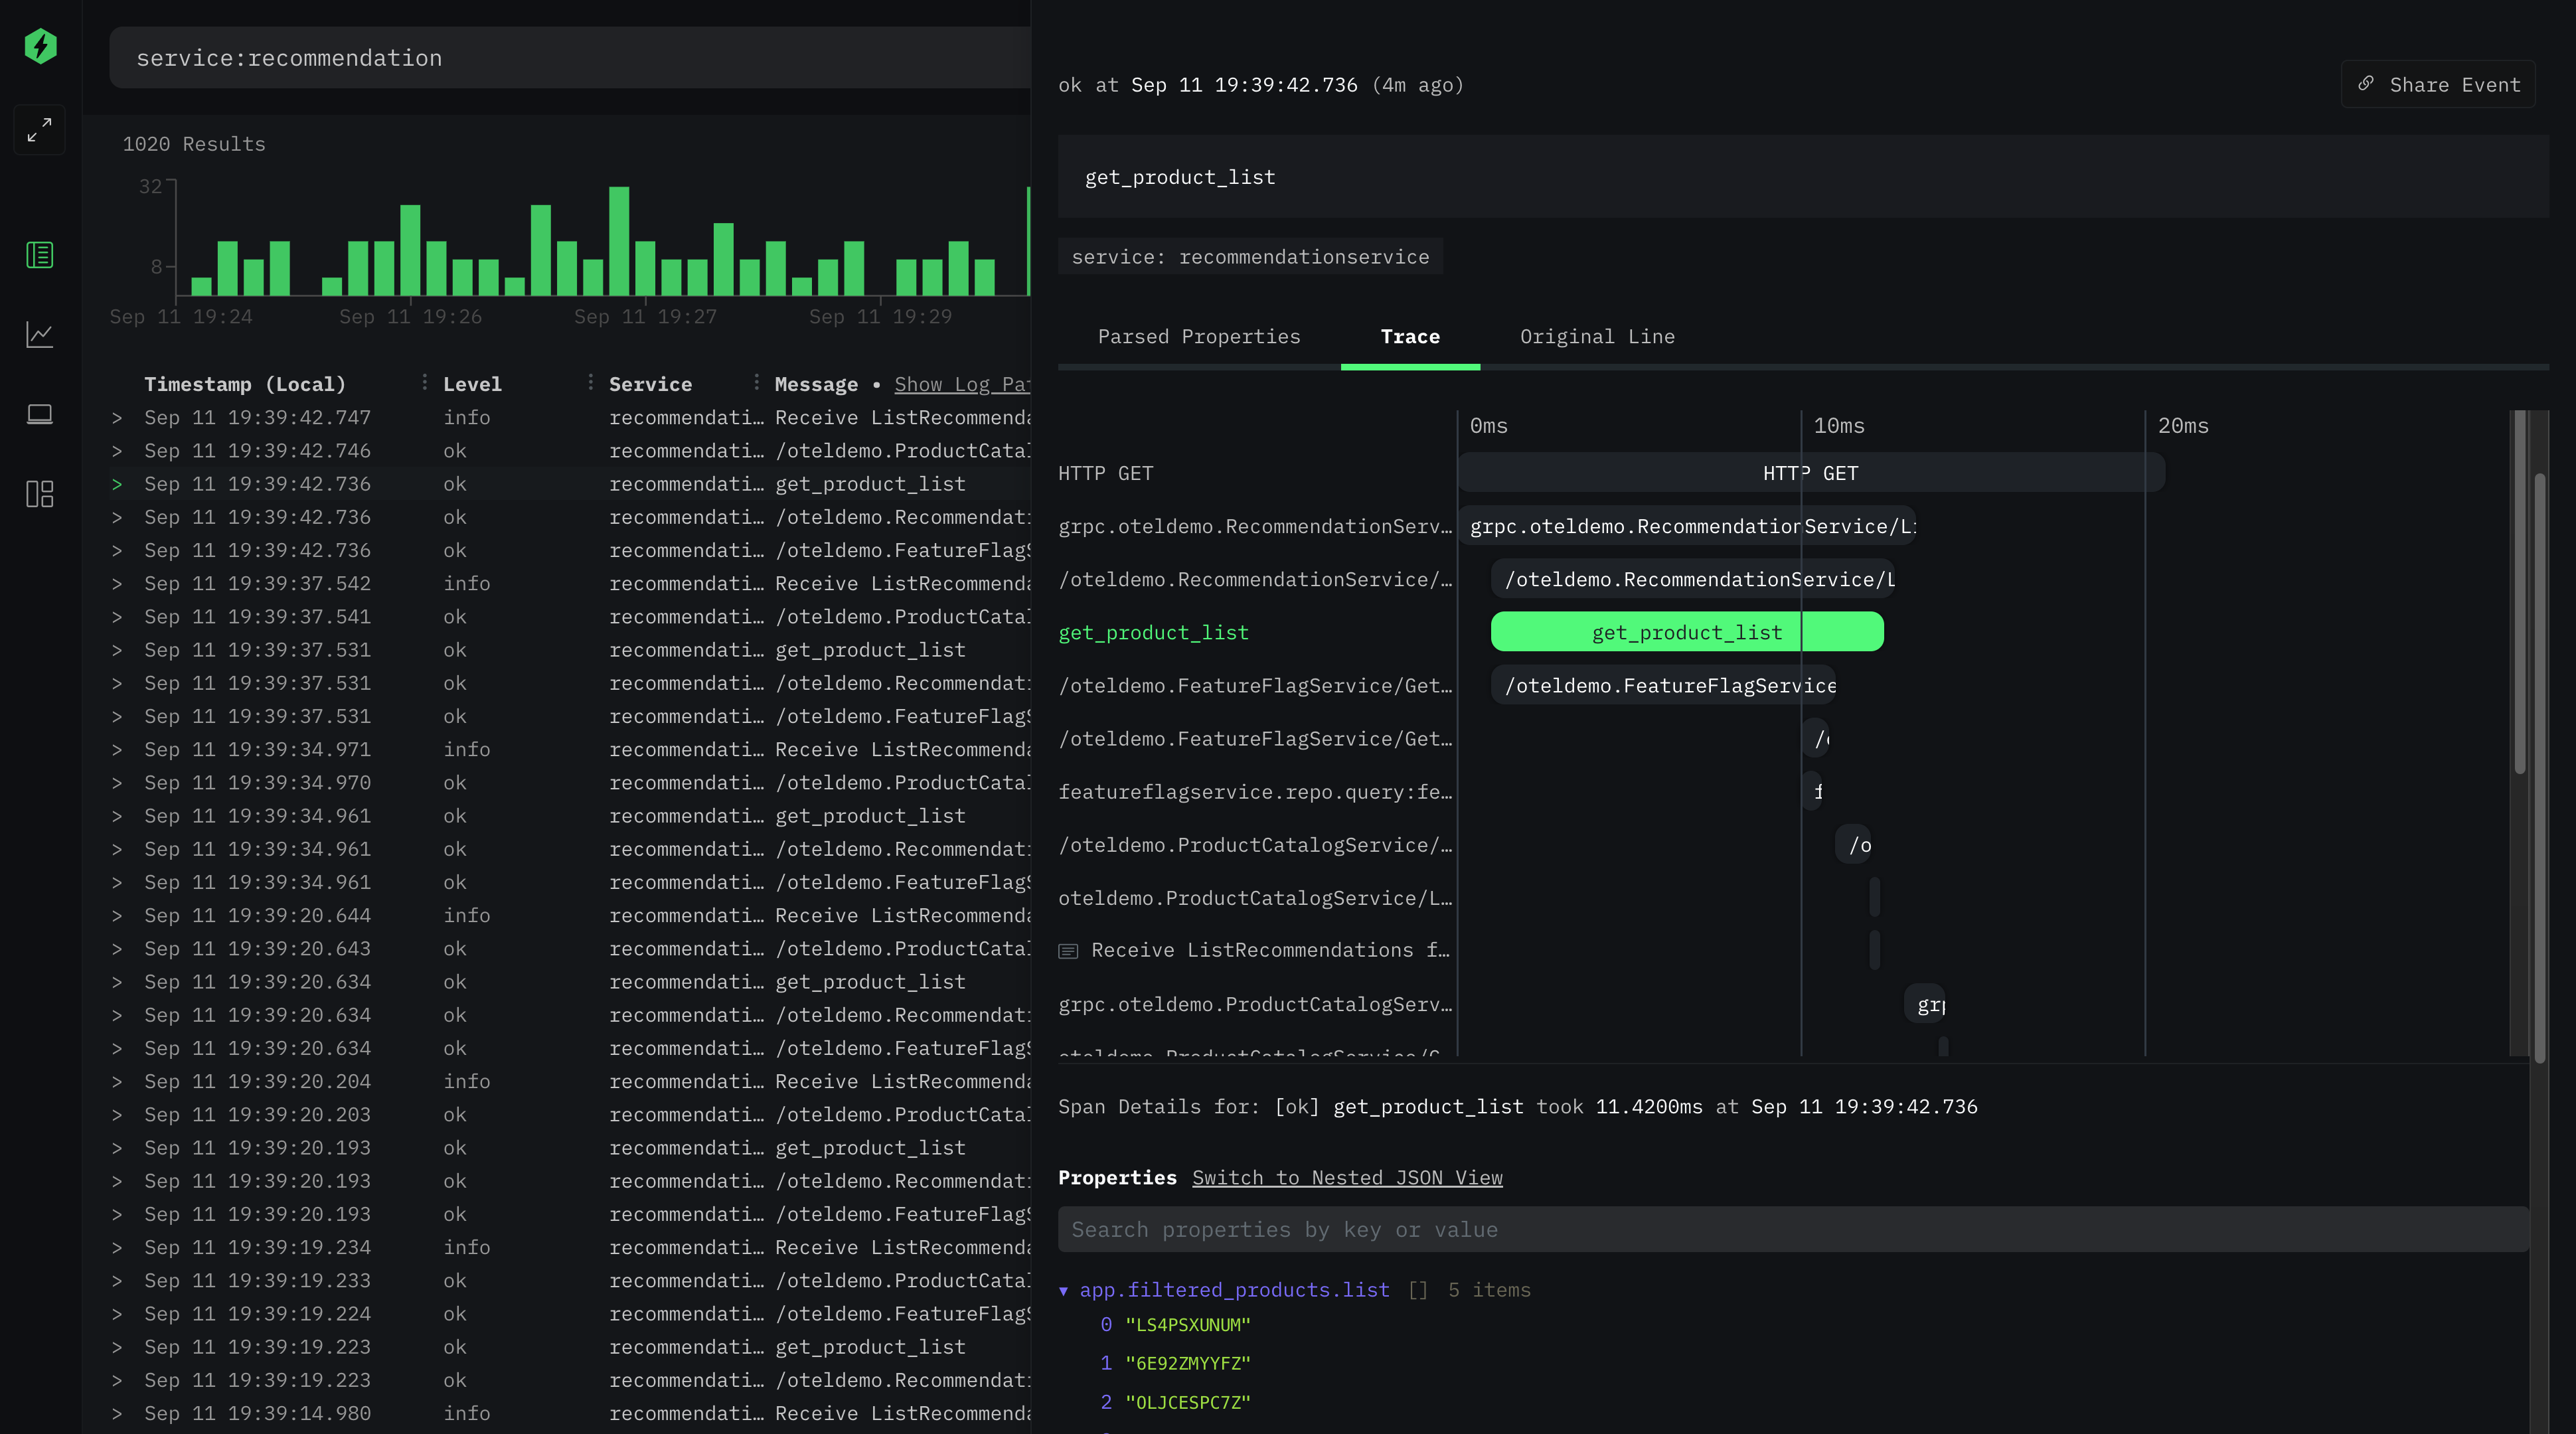
HyperDX's standout feature is its search. Powered by ClickHouse, queries complete in milliseconds on datasets that would leave Elasticsearch gasping. The search syntax supports both full-text queries and property filters like level:error service:api-gateway. You can live-tail logs in real-time — useful during deployments when you need instant feedback.
The "no SQL required" philosophy is genuine. While advanced users can drop into SQL, most searches can be expressed with simple key:value pairs. This dramatically lowers the barrier for developer adoption.
Correlation: Where HyperDX Shines
The real magic happens when you correlate across data types. Click on a trace span, and you instantly see the related logs for that request. Session replays play back exactly what the user saw when an error occurred. This level of correlation eliminates the painful context-switching required with separate monitoring tools.
Session Replays
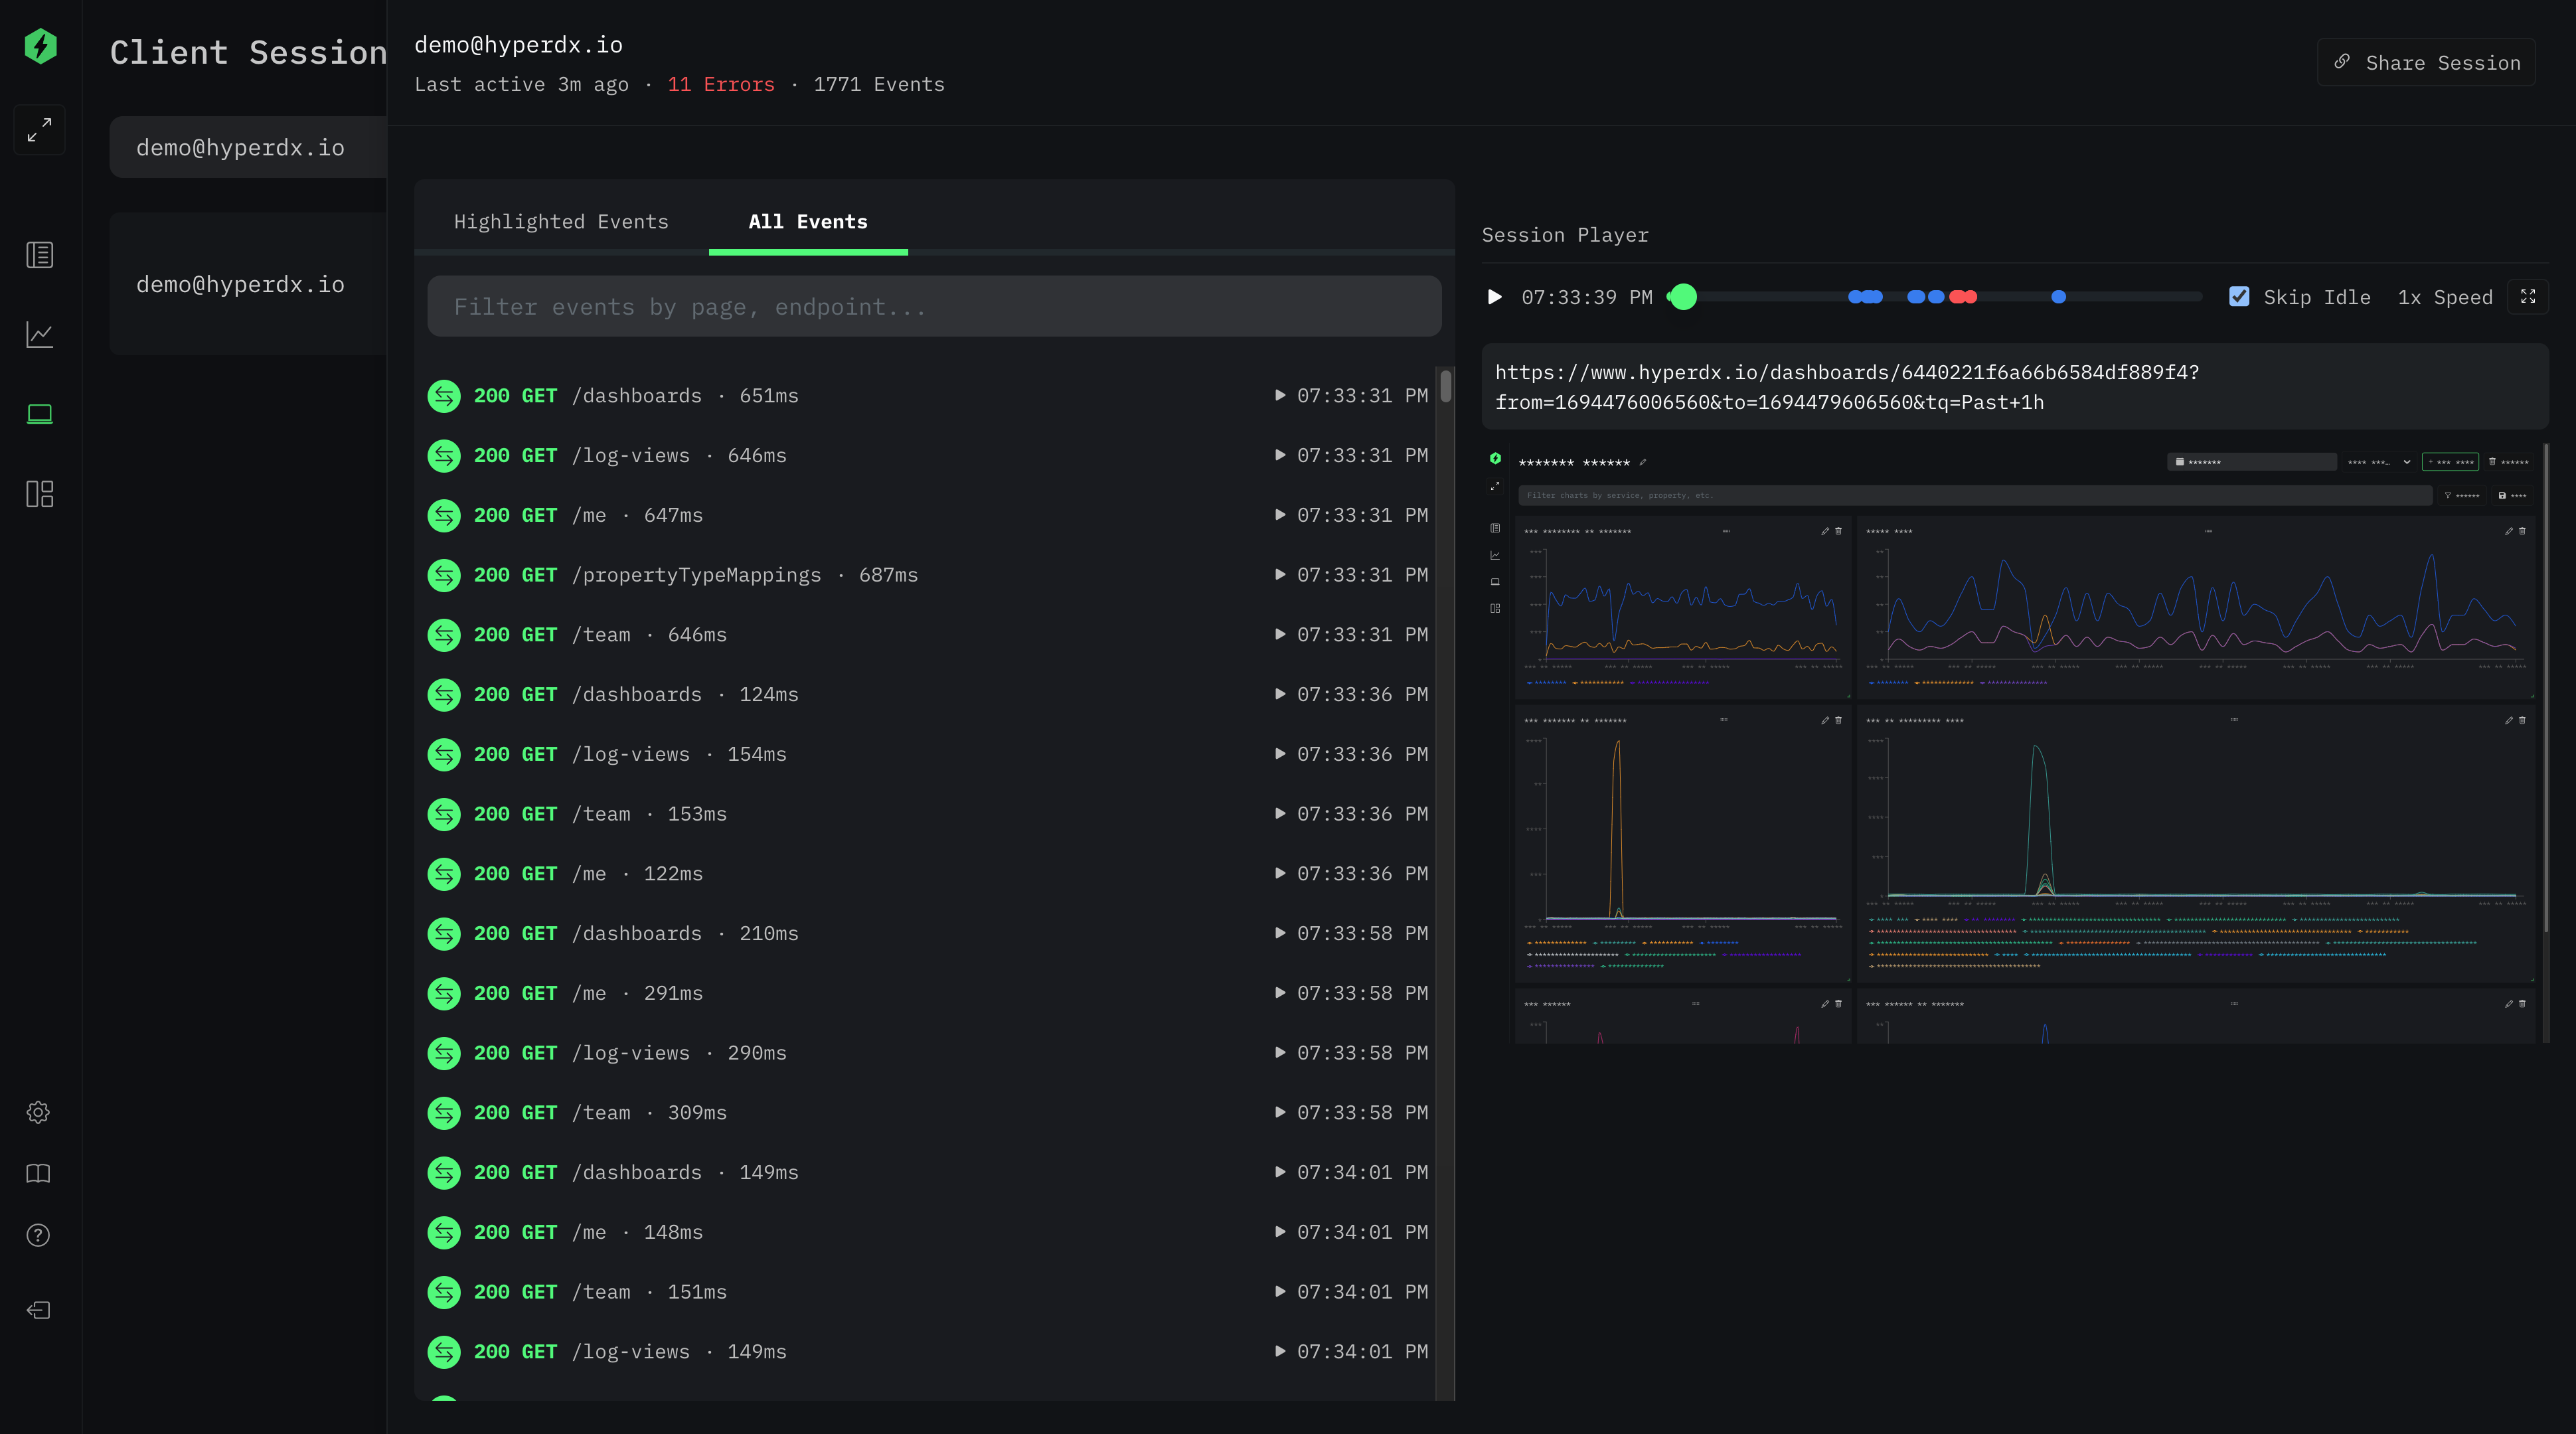
Session replay is a game-changer for frontend debugging. Instead of reading log lines and guessing what happened, you can watch the actual user session — mouse movements, clicks, navigation — leading up to an error. This feature alone can cut debugging time by 50% or more for frontend issues.
Dashboarding & Alerts
Creating dashboards is intuitive. The query builder translates visual selections into the underlying search syntax, so you don't need to learn yet another query language. Alerts can be configured on any search with thresholds, and they integrate via webhook with PagerDuty, Slack, and other tools.
Comparison with Alternatives
| Feature | HyperDX | Datadog | Grafana Stack |
|---|---|---|---|
| Pricing | 🆓 Free (self-hosted) | 💰 $$$ per host | 🆓 Free (self-hosted) |
| Setup Complexity | One Docker command | Agent install + config | Multiple services to manage |
| Search Speed | ⚡ Blazing (ClickHouse) | Fast (proprietary) | Moderate (Loki/ES) |
| Session Replay | ✅ Built-in | ✅ Built-in | ❌ Requires extra tools |
| OpenTelemetry | ✅ Native | ✅ Supported | ✅ Supported |
Verdict
HyperDX is an excellent choice for teams that want an integrated observability experience without the complexity of managing multiple tools. It's particularly strong for:
- Teams already using or adopting ClickHouse
- Startups and SMBs needing enterprise-grade observability on a budget
- Frontend-heavy applications where session replay adds critical context
- Engineers who prefer simple search syntax over complex query languages
The main consideration is that HyperDX is relatively newer than established alternatives, so the ecosystem of community integrations is still growing. However, the core platform is production-ready and actively maintained with frequent releases.
🚀 Try HyperDX today — completely self-hosted and free.
Docker Compose config, system requirements, and deployment guide on one page.
View HyperDX Tool Page →