Laminar Guide: Open-Source Observability for AI Agents
A comprehensive guide to Laminar — an open-source observability platform purpose-built for AI agents with OpenTelemetry-native tracing, evals, and real-time dashboards.
What Is Laminar?
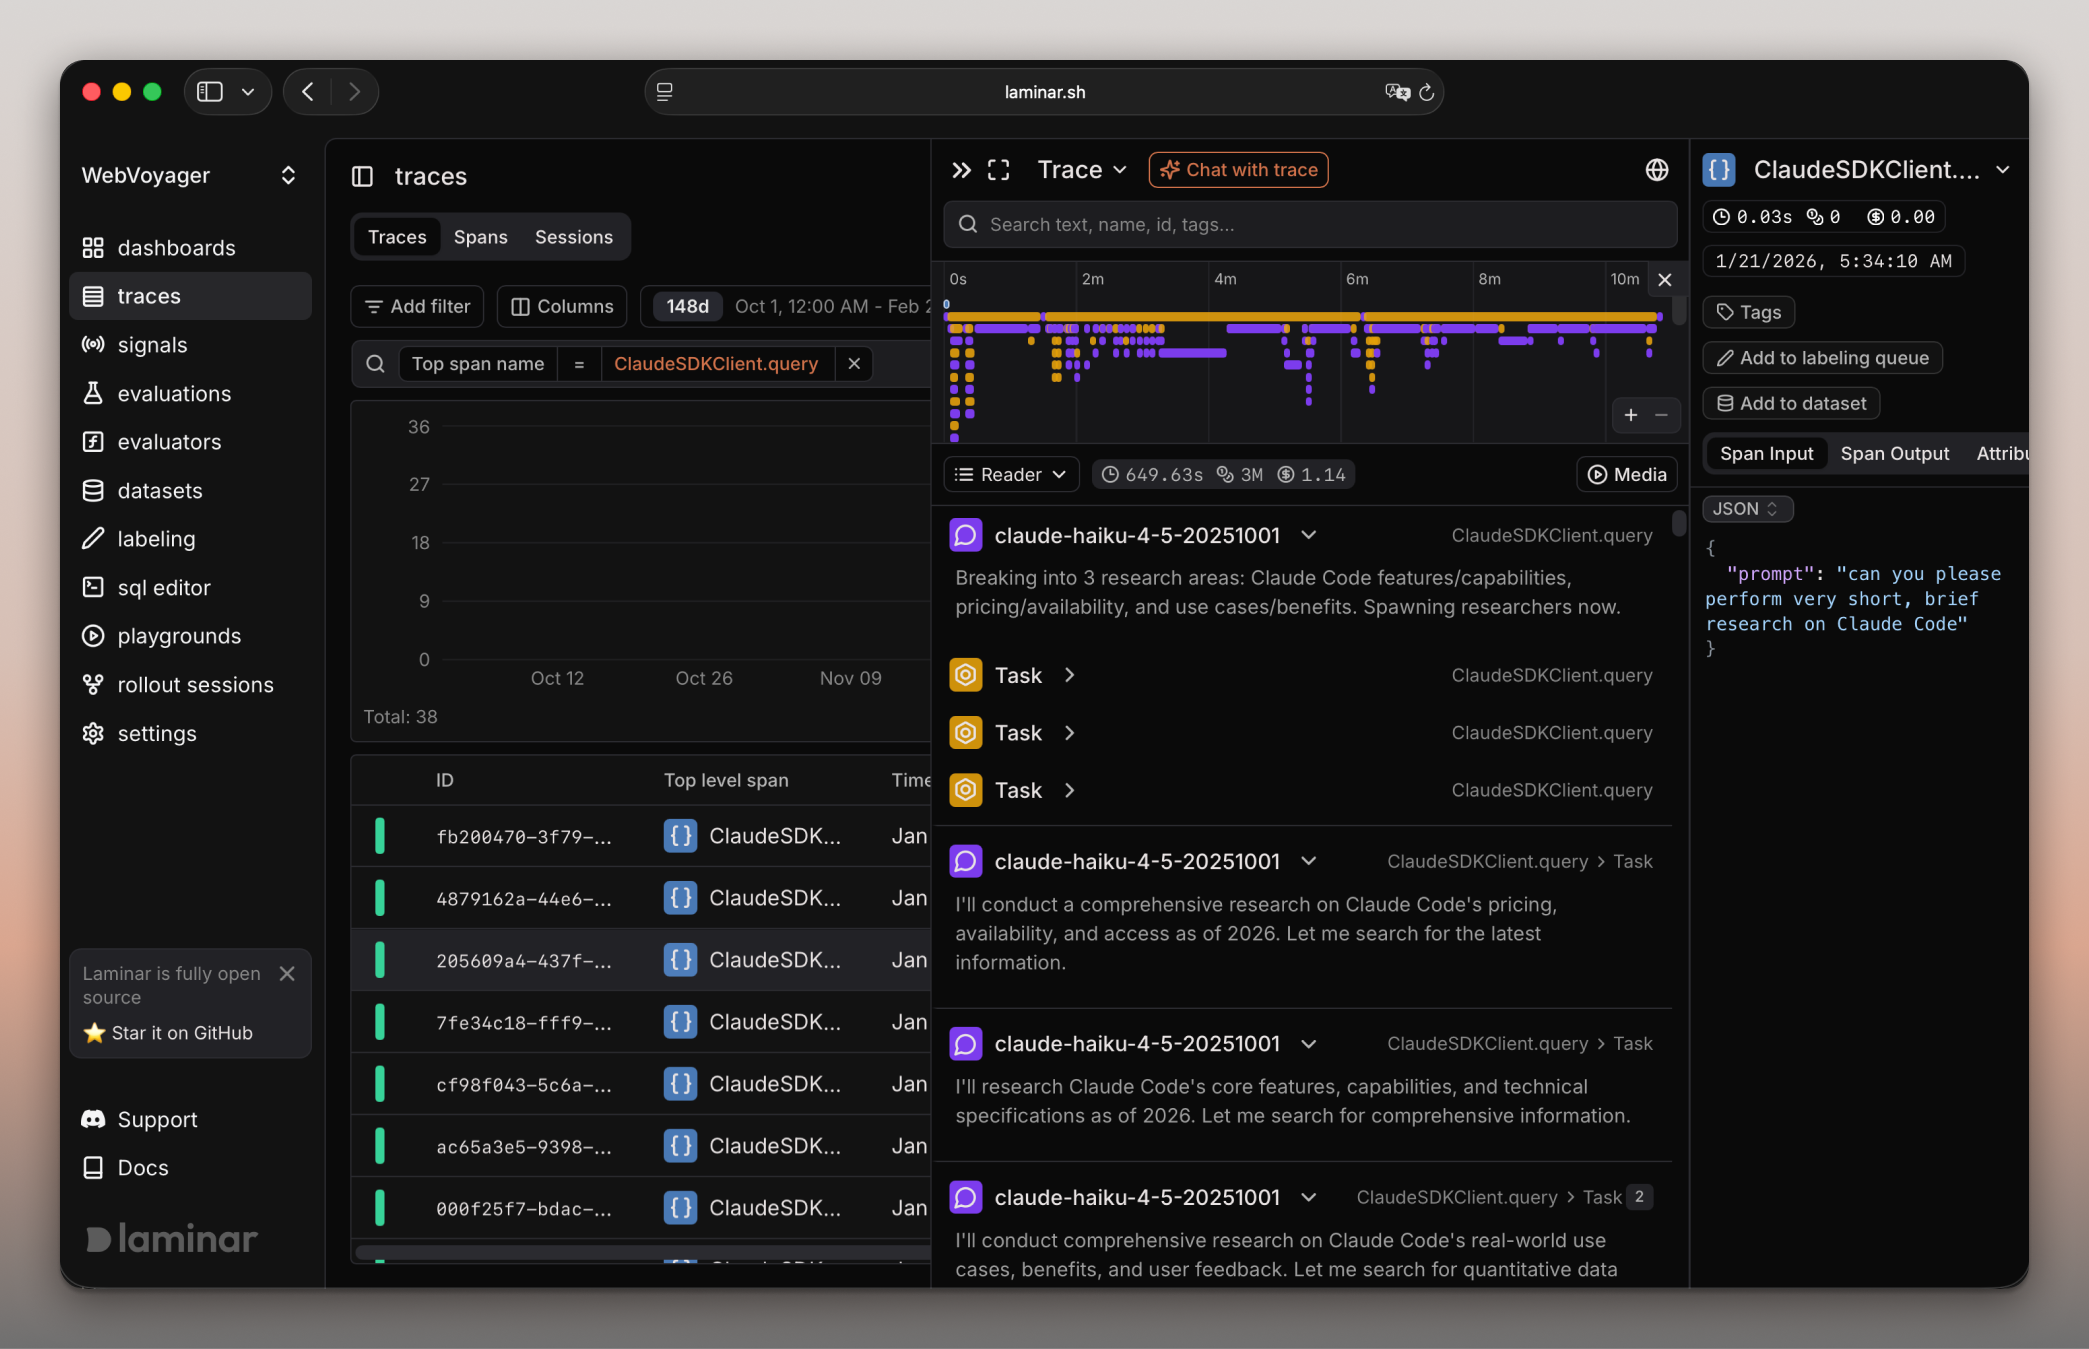
Laminar is an open-source observability platform purpose-built for AI agents. Unlike generic APM tools, Laminar understands the unique structure of agentic workflows — LLM calls, tool invocations, MCP interactions, and evaluation results — and surfaces them in real-time dashboards built on OpenTelemetry.
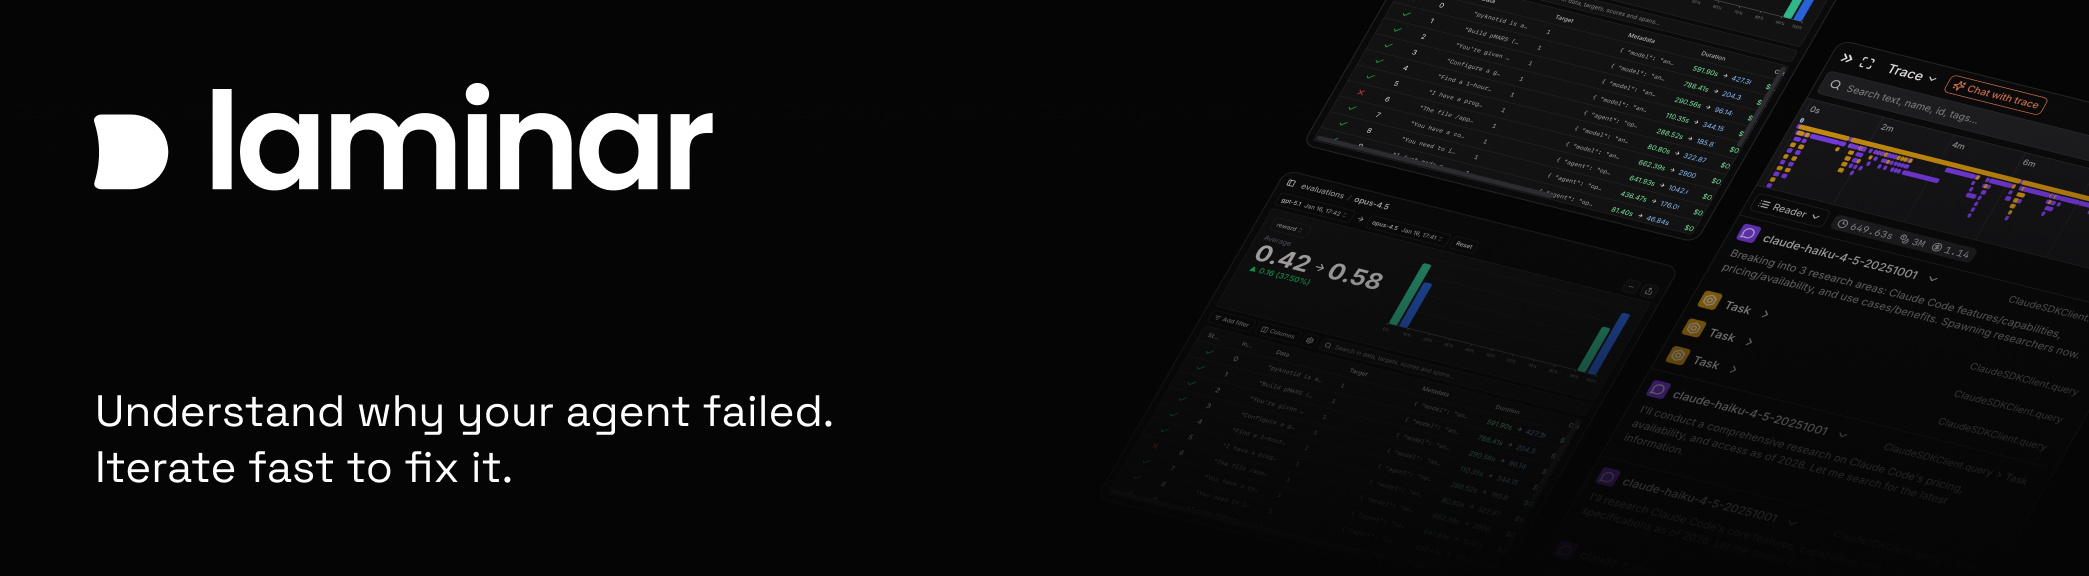
Backed by Rust for performance and Y Combinator (S24), Laminar is designed for teams who need deep visibility into their AI agent pipelines without sending data to third-party cloud services.
🚀 Want to deploy Laminar yourself?
Docker configs, system requirements, and installation guides — all on one page.
View Laminar Tool Page →Key Features
| Feature | Description |
|---|---|
| 🔍 Native Tracing | OpenTelemetry-native traces for every step of agent execution — LLM calls, tool use, MCP requests. |
| 📊 Real-Time Dashboards | Live metrics on latency, token usage, error rates, and agent flow visualization. |
| ✅ Built-in Evals | Evaluate agent outputs with custom scoring and automated test suites. |
| 🔌 MCP + CLI Access | Integrate via Model Context Protocol or CLI — fits any agent framework. |
| ⚡ Self-Hosted | Deploy with a single Docker command. No external dependencies, full data control. |
Why Laminar for AI Agent Observability?
Traditional observability tools treat everything as generic spans and metrics. Laminar is different — it understands the semantic structure of AI agents. When you trace an agent workflow, Laminar automatically identifies:
- Which LLM model was called and what prompt was used
- Which tools the agent invoked and their results
- MCP server interactions and response times
- Evaluation scores per step
- End-to-end latency breakdowns
This makes debugging agentic loops, identifying slow LLM calls, and measuring the quality of agent outputs dramatically easier than with generic monitoring tools.
Getting Started
Deploying Laminar takes seconds with Docker:
docker run -d --name laminar -p 8080:8080 \
  -v ./data:/data \
  laminar/laminar-node:latest
Once running, access the dashboard at http://localhost:8080 and connect your AI agent framework via OpenTelemetry SDK, MCP, or the Laminar CLI.
System Requirements
| Minimum | Recommended | |
|---|---|---|
| CPU | 2 cores | 4 cores |
| RAM | 4 GB | 8 GB |
| Disk | 10 GB | 20 GB |
| Docker | 20.10+ | |
🚀 Ready to monitor your AI agents with Laminar?
Full setup guide, Docker Compose templates, and requirements — all in one place.
View Laminar Tool Page →