How to Monitor AI Agents with Laminar: Step-by-Step Tutorial
A hands-on tutorial for setting up Laminar to monitor your AI agents — from Docker deployment to tracing, evaluations, and dashboard insights.
Step-by-Step: Monitoring AI Agents with Laminar
This tutorial walks you through setting up Laminar and connecting it to your AI agent framework for real-time observability. By the end, you'll have full tracing, evaluation, and dashboard visibility into your agent's behavior.
🚀 Want to deploy Laminar yourself?
Docker configs, system requirements, and installation guides — all on one page.
View Laminar Tool Page →Step 1: Deploy Laminar with Docker
Start the Laminar server using Docker Compose or the direct Docker command:
# Using Docker Compose (recommended)
services:
  laminar:
    image: laminar/laminar-node:latest
    restart: unless-stopped
    ports:
      - 8080:8080
    volumes:
      - ./data/laminar:/data
docker compose up -dOpen http://localhost:8080 in your browser. You should see the Laminar dashboard.
Step 2: Connect Your AI Agent
Laminar integrates with any AI agent framework through OpenTelemetry. Here's how to connect a Python agent using the OpenTelemetry SDK:
pip install opentelemetry-api opentelemetry-sdk \
  opentelemetry-exporter-otlp-proto-http

from opentelemetry import trace
from opentelemetry.exporter.otlp.proto.http.trace_exporter \
  import OTLPSpanExporter
from opentelemetry.sdk.trace import TracerProvider
from opentelemetry.sdk.trace.export import BatchSpanProcessor

# Configure Laminar as the OTLP endpoint
exporter = OTLPSpanExporter(
    endpoint="http://localhost:4318/v1/traces"
)
provider = TracerProvider()
provider.add_span_processor(BatchSpanProcessor(exporter))
trace.set_tracer_provider(provider)
Step 3: Trace Agent Execution
Wrap your agent's workflow with Laminar spans to track every step:
tracer = trace.get_tracer(__name__)

with tracer.start_as_current_span("agent-run") as span:
    span.set_attribute("agent.name", "my-agent")
    span.set_attribute("llm.model", "gpt-4")

    # Track tool call
    with tracer.start_as_current_span("tool-call") as tool_span:
        tool_span.set_attribute("tool.name", "web_search")
        result = search_web(query)
        tool_span.set_attribute("tool.result_length", len(result))

    # Track LLM call
    with tracer.start_as_current_span("llm-call") as llm_span:
        llm_span.set_attribute("llm.prompt_tokens", 450)
        llm_span.set_attribute("llm.completion_tokens", 120)
        response = llm.generate(prompt)
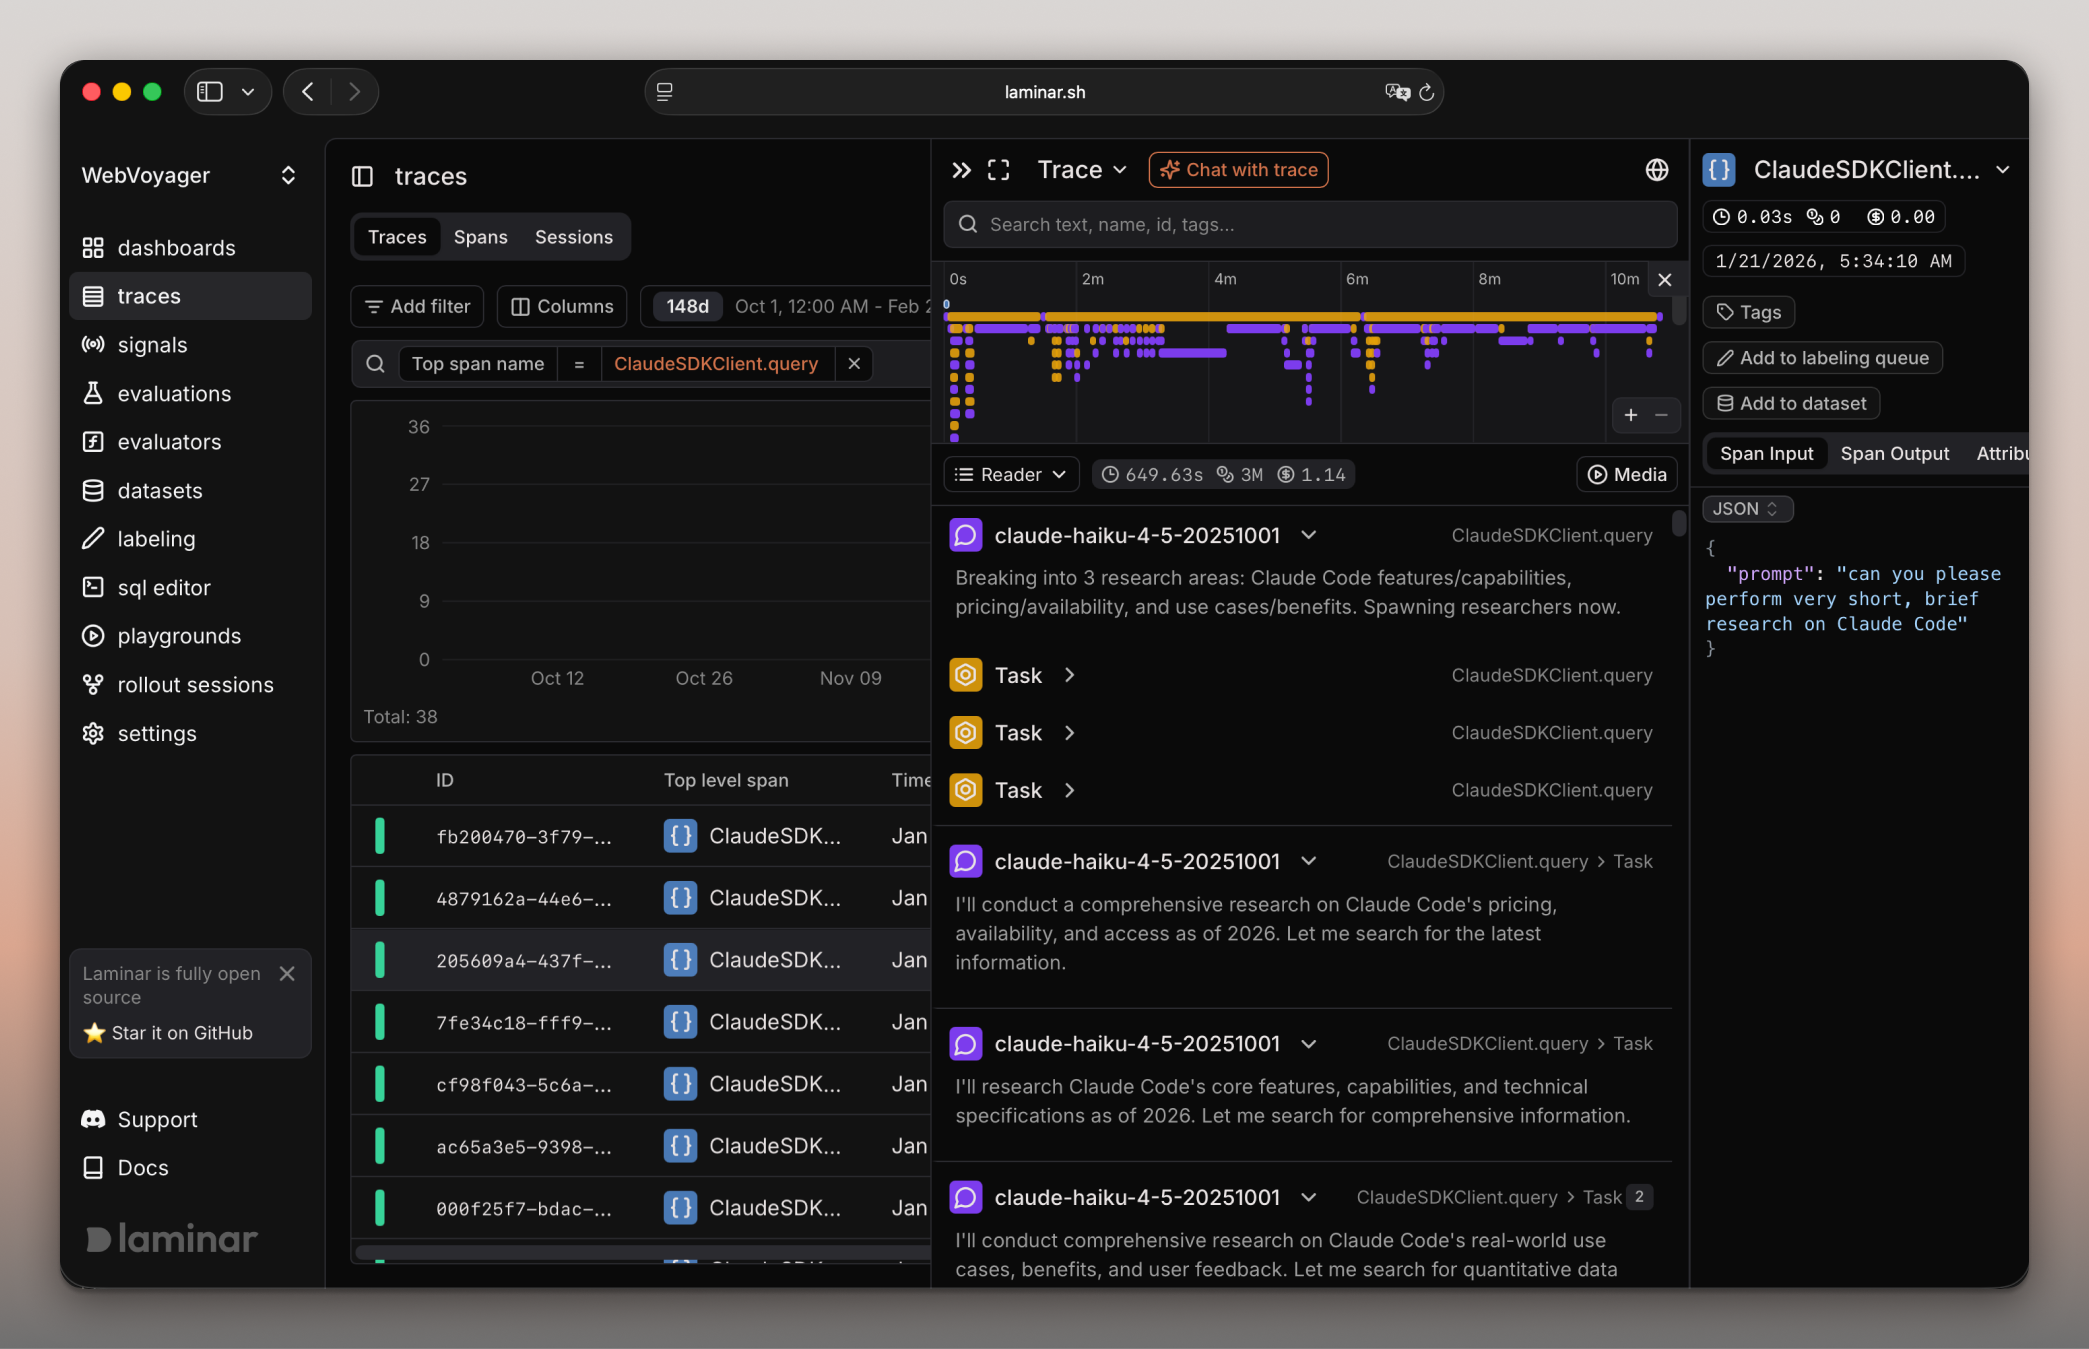
Each span automatically appears in the Laminar dashboard with timing, attributes, and nested relationships.
Step 4: Set Up Evaluations
Laminar includes a built-in eval framework. Add evaluation scoring to your traces:
# Using Laminar CLI
laminar eval create --name "response-quality" \
  --metric accuracy \
  --threshold 0.8

# Score a trace
laminar eval score --eval-id 1 \
  --trace-id "$TRACE_ID" \
  --score 0.92 \
  --comment "Accurate and well-structured response"
Step 5: Monitor with the Dashboard
The Laminar dashboard gives you:
- Live trace viewer — see each agent run as it happens
- Signal analysis — track latency, token usage, error rates
- Eval scores — historical view of your agent's quality metrics
- MCP server monitoring — if your agent uses MCP, see server health and response times
Comparison with Alternatives
| Feature | Laminar | Generic APM |
|---|---|---|
| AI-native semantics | ✅ Yes | ❌ No |
| Built-in evals | ✅ Yes | ❌ No |
| MCP support | ✅ Native | ❌ No |
| OpenTelemetry-native | ✅ Yes | ✅ Yes |
| Self-hosted | ✅ Yes | ⚠️ Varies |
Conclusion
Laminar fills a critical gap in the AI agent ecosystem: purpose-built, self-hosted observability. Whether you're building a simple RAG pipeline or a complex multi-agent system with MCP servers, Laminar's OpenTelemetry-native tracing and eval framework give you the visibility you need to debug, optimize, and trust your agents.
🚀 Ready to deploy Laminar and take control of your AI agent monitoring?
Docker Compose, system requirements, and full documentation — all in one place.
View Laminar Tool Page →