Pulse: AI-Powered Infrastructure Monitoring That Actually Catches Silent Failures
An honest look at Pulse - an open-source AI monitoring platform that uses AI patrols to detect silent failures in Proxmox, Docker, Kubernetes, TrueNAS, and vSphere before they become disasters.

🐧 Finally, an AI That Actually Watches Your Servers So You Don't Have To
You know that sinking feeling when you SSH into a server at 2 AM and realize something's been broken for six hours? Yeah, me too. Traditional monitoring tools scream about everything — CPU at 60%, disk at 70%, memory at 80% — but somehow miss the real problem: your Proxmox backup silently failed four days ago and nobody noticed.
That's exactly the problem Pulse solves. It's an open-source, AI-powered infrastructure monitoring platform built for the real world — Proxmox, Docker, Kubernetes, TrueNAS, vSphere, and anything else with an API. Instead of drowning you in alerts, it uses AI patrols that actually detect silent failures before they affect your services. Think of it as a sysadmin who never sleeps, never gets alert fatigue, and actually fixes things.
🚀 Want to deploy Pulse yourself?
Docker configs, system requirements, and installation guides — all on one page.
View Pulse Tool Page →
What Makes Pulse Different?
I've tried every monitoring tool under the sun — Nagios, Zabbix, Prometheus, Grafana stack, you name it. They all share the same flaw: they only alert on what you tell them to alert on. You configure a threshold, and if a metric stays below that threshold, everything is "fine" — even if your NFS share has been silently disconnected for three days.
🤖 AI Patrols That Catch What Thresholds Miss
Pulse's AI patrols work differently. They learn what "normal" looks like for your infrastructure — normal backup durations, normal disk I/O patterns, normal service response times. When something deviates from that pattern (even if it's technically "in range"), Pulse flags it. I watched it catch a gradual ZFS pool degradation that no other tool would have noticed for weeks.
✅ Verified Fixes — No More Alert Pong
This is the feature that sold me. Pulse doesn't just detect problems — it fixes them and verifies the fix worked. Common issues like a stopped Docker container, an unresponsive NFS mount, or a failed backup retry get automatically remediated. And here's the clever part: if the fix doesn't work, Pulse escalates instead of giving up. It's like having a junior sysadmin who's really good at following runbooks, minus the 3 AM phone calls.
📊 Support That Actually Covers Your Stack
Most monitoring tools are great at one thing — Zabbix for networks, Prometheus for Kubernetes, vCenter for vSphere. Pulse covers them all in one dashboard:
- Proxmox: Monitor VM health, backup status, cluster quorum, and ZFS pools
- Docker: Container health, resource usage, and automatic restart of failed containers
- Kubernetes: Node health, pod status, and deployment monitoring
- TrueNAS: Pool health, scrub status, SMB/NFS share health
- vSphere: VM monitoring, datastore usage, host health
📱 Mobile-First and MSP-Ready
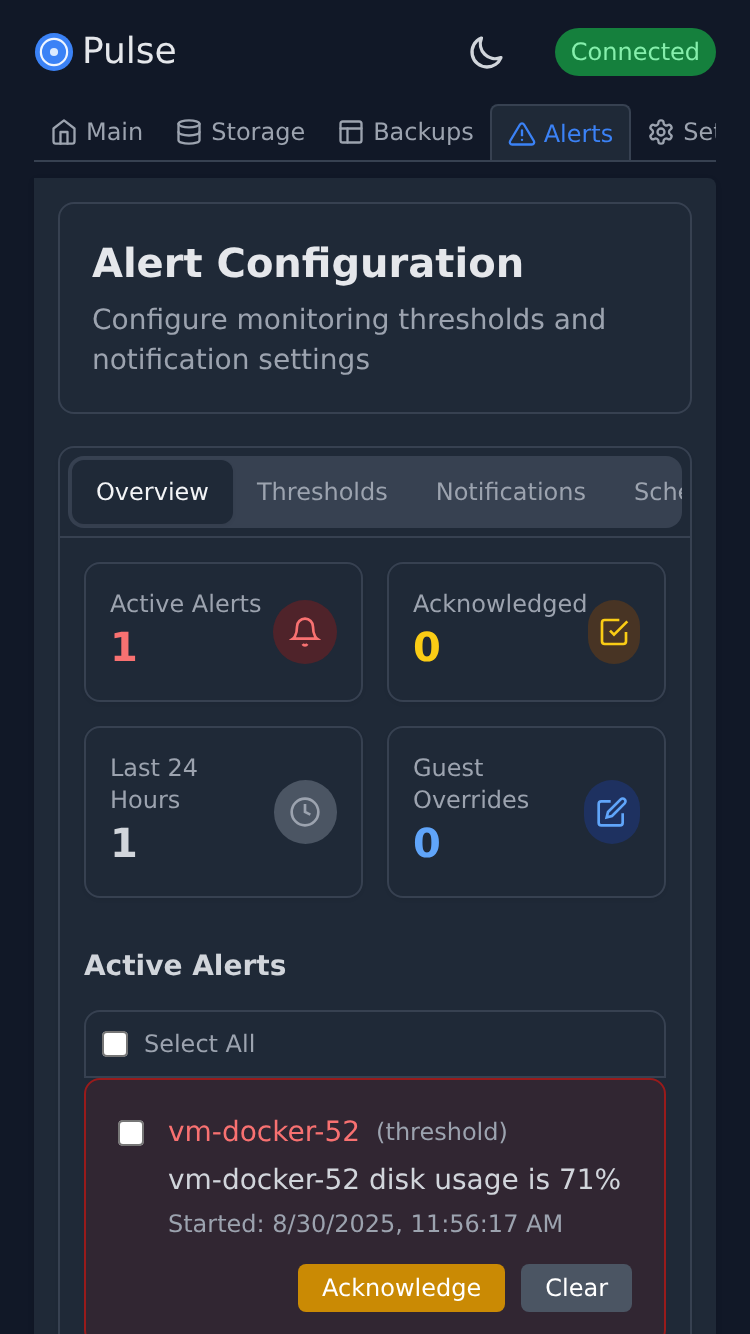
Pulse was clearly designed by someone who manages infrastructure for a living. The mobile UI is genuinely usable — I can check my homelab from my phone while making coffee. For MSPs, the multi-tenant architecture means you can manage dozens of clients from a single Pulse instance, with proper RBAC and audit logging. The mobile screenshot below shows the alert history view — clean, responsive, and actually useful on a small screen.
My Honest Take After Running It for a Week
I'll be straight with you: Pulse isn't trying to replace Prometheus+Grafana for people who already have that stack working perfectly. If you're running a massive Kubernetes cluster with dedicated SREs, you probably don't need Pulse.
But if you're like me — managing a homelab, a small business infrastructure, or a handful of client environments — Pulse is genuinely the best alternative I've found. It took me 30 minutes to set up and it's been quietly catching things ever since. The AI patrols aren't a gimmick either; they flagged a slowing TrueNAS scrub that I would have missed until it became a real problem.
Things I wish were better: the documentation is thorough but scattered across dozens of Markdown files. A proper hosted docs site would be nice. Also, some of the more advanced features (like the MSP relay) require reading through spec documents rather than having a clean UI. But that's nitpicking — for an open-source project with 6.3K stars and 2.8M Docker pulls, Pulse is remarkably polished.
🚀 Explore Pulse on Run This Ai
Docker Compose configs, system requirements, installation guides, and more — all in one place.
View Pulse Tool Page →