Apache HertzBeat Guide — AI-Powered Open-Source Observability for Your Infrastructure
A complete guide to Apache HertzBeat, the AI-powered open-source observability system. Learn about its 200+ monitoring protocols, anomaly detection, alerting, and why 7300+ stars trust it.

Your Monitoring Stack Is Too Complicated — Here's a Better Way
I've been running production infrastructure for years, and honestly? Traditional monitoring tools are a pain. Prometheus needs a PhD to configure properly. Nagios looks like it's from 1999. Datadog is great until you see the bill. So when I found Apache HertzBeat, I was skeptical — another monitoring tool? But this one's different.
HertzBeat is an AI-powered, open-source observability system that actually does what it promises: real-time monitoring for apps, databases, servers, containers, and networks — all from a single dashboard. And it's backed by the Apache Software Foundation, so you know it's not going to disappear next month.
🚀 Want to deploy Apache HertzBeat yourself?
Docker configs, system requirements, and installation guides — all on one page.
View Apache HertzBeat Tool Page →What Makes HertzBeat Different?
200+ Monitoring Protocols Out of the Box
This is what sold me. JMX, SNMP, HTTP, ICMP, TCP, custom scripts — HertzBeat supports over 200 monitoring protocols and templates right out of the box. Want to monitor a PostgreSQL database? Done. A Kubernetes cluster? Easy. A custom REST API? One HTTP monitor template and you're set. I spent maybe 10 minutes getting my first 5 monitors up. Ten. Minutes.
AI-Powered Anomaly Detection
Here's the thing about traditional monitoring — it drowns you in alerts. CPU at 95%? Alert. Memory at 80%? Alert. Disk filling up? Alert. HertzBeat's AI engine learns your baseline and only alerts when something's actually wrong. It predicts issues before they happen and cuts the noise by a huge margin. I turned off 3 different alert channels after setting this up because they were just spam.
Agent-Based AND Agentless
Most tools force you into one mode. HertzBeat supports both: deploy collectors for deep system metrics, or go agentless for quick HTTP/TCP checks. The distributed architecture means you can run collector clusters at scale, and it works with multiple time-series databases — VictoriaMetrics, TDengine, IoTDB, InfluxDB, GreptimeDB. Your choice.
Visual Topology Builder
This is actually fun to use. Instead of writing YAML to define your infrastructure dependencies, you just drag and drop. It builds a live topology map of your services, databases, and networks. When something goes down, you can see the blast radius visually. No more "which microservice is this alert even for?" moments.
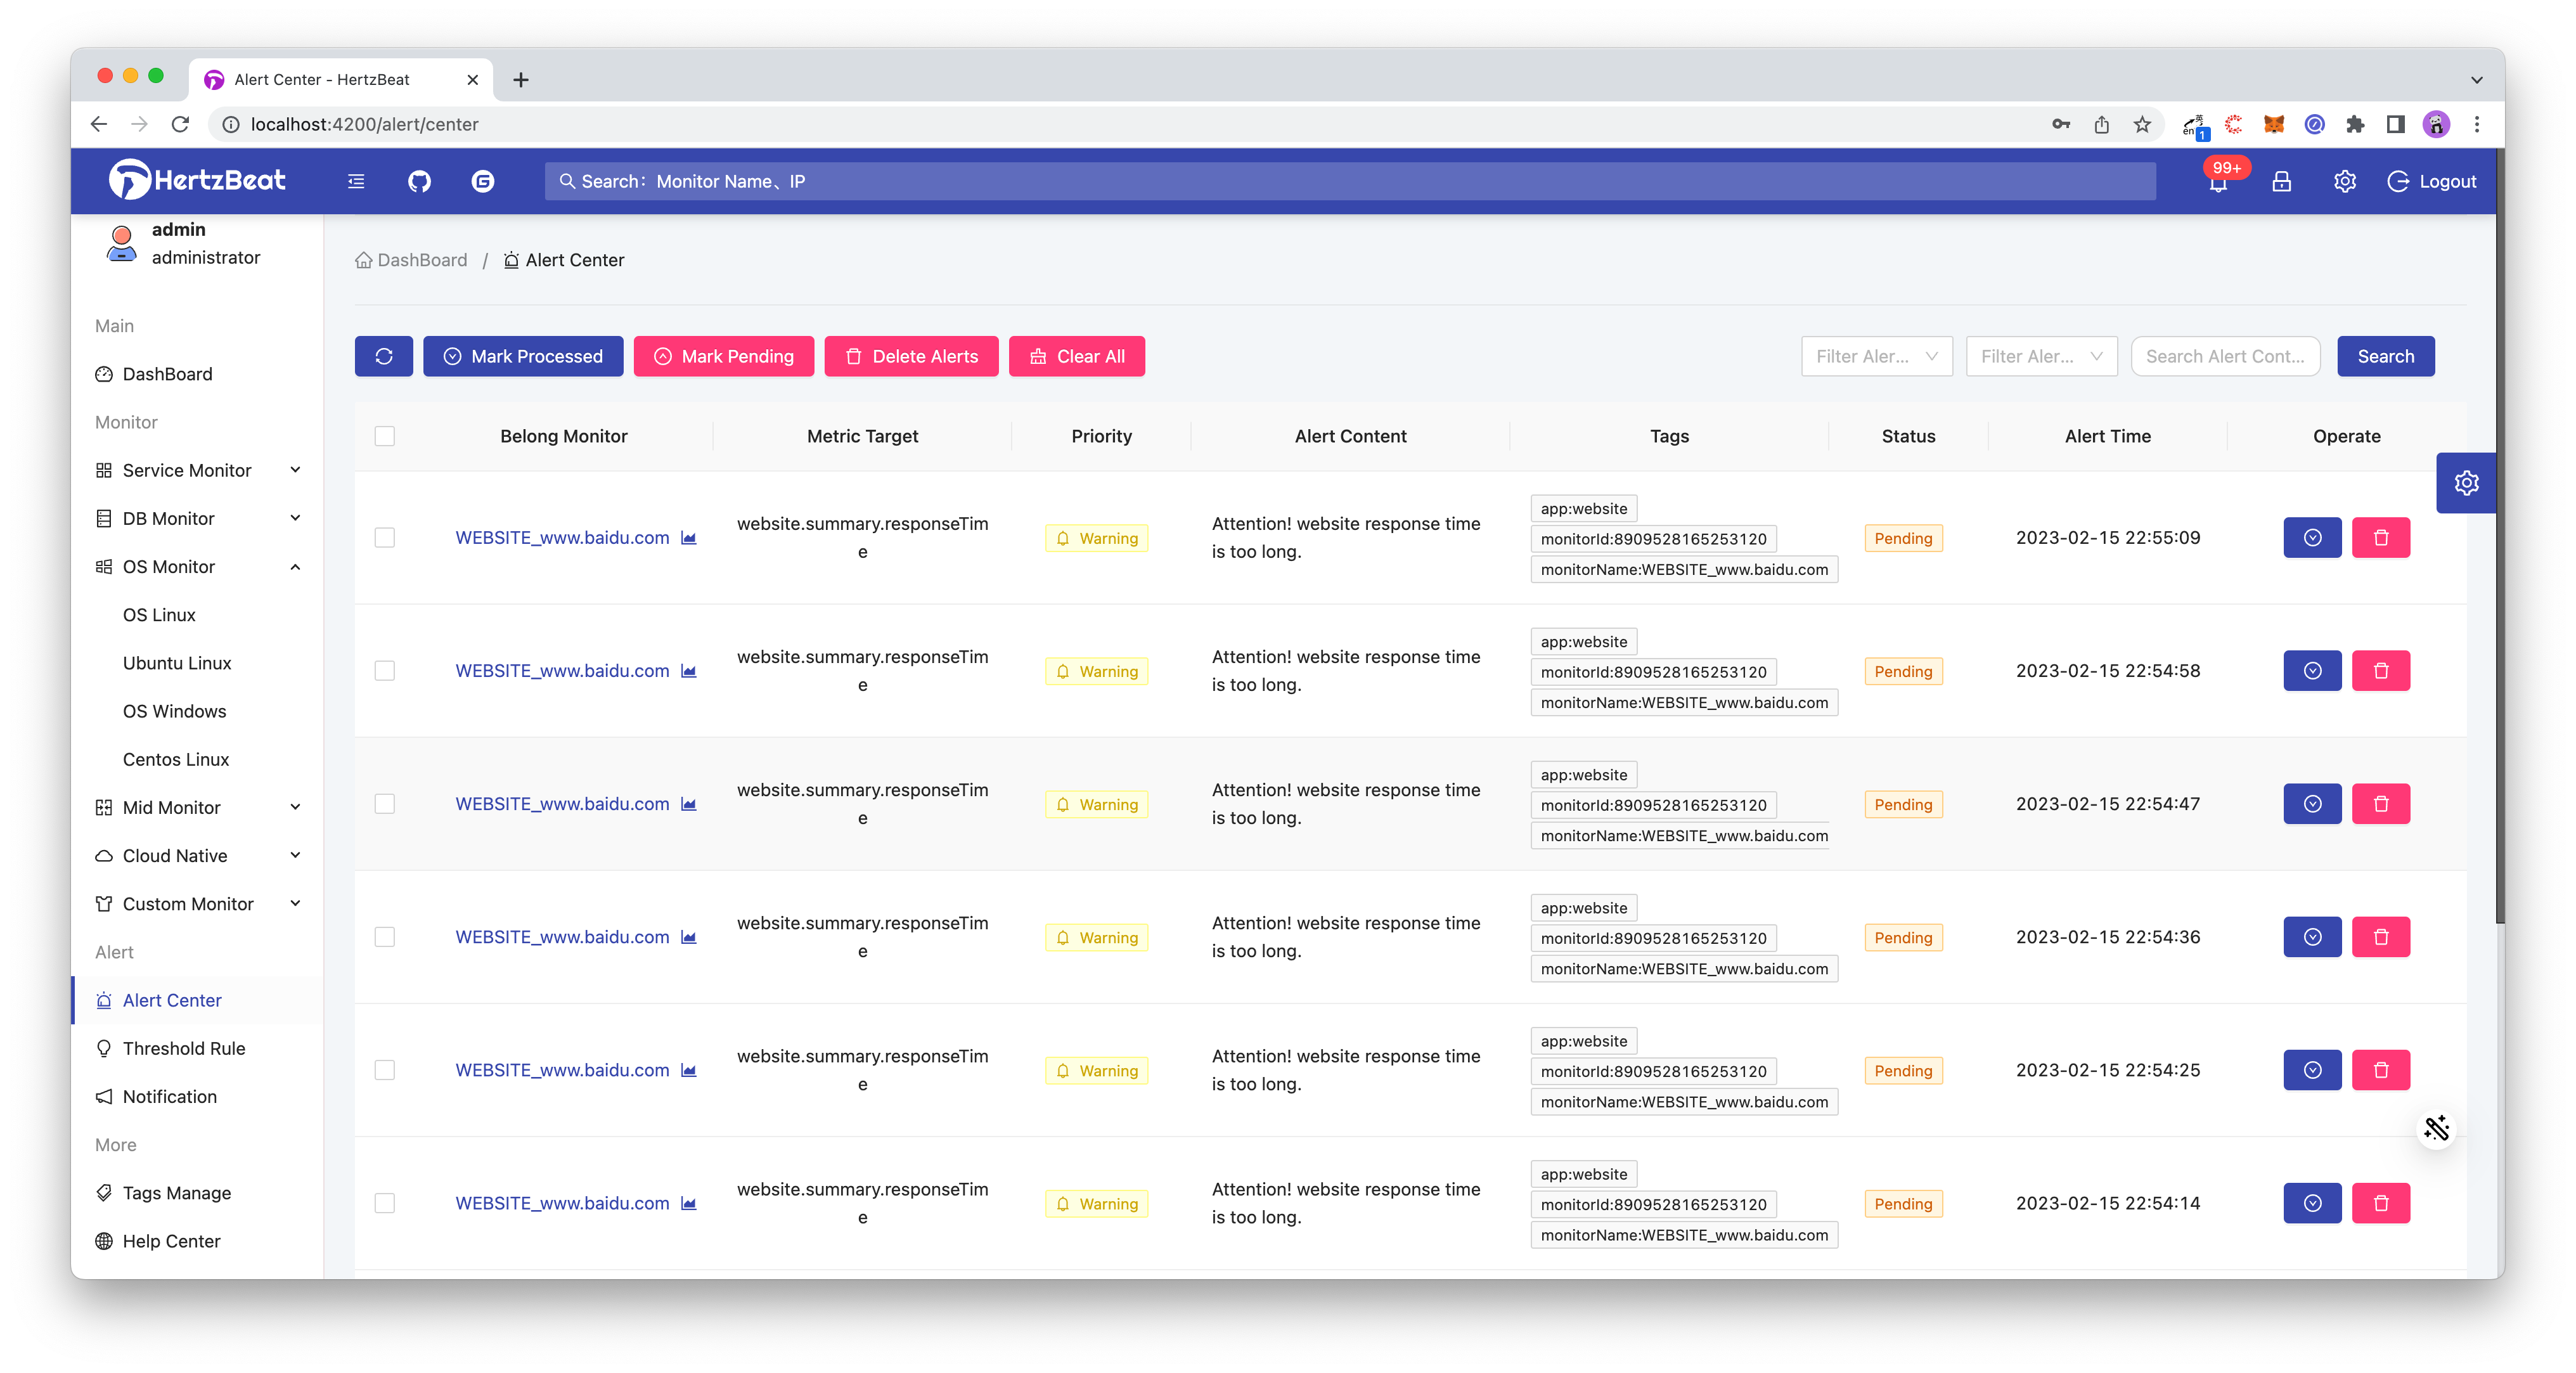
Alert Channels That Actually Work
HertzBeat supports email, webhook, DingTalk, WeChat, Slack, and Telegram for alerts. I've got mine sending critical alerts to Telegram (instant) and daily summaries to Slack. The alert deduplication and grouping is smart — it doesn't spam you with 50 alerts for one incident. It groups related alerts and escalates intelligently.
Who Is HertzBeat For?
DevOps teams who need deep infrastructure visibility without the complexity of traditional monitoring stacks. SREs who want AI-powered insights. Startups that can't afford Datadog or New Relic but need real monitoring. Self-hosters who want full control of their data.
Who it's NOT for: If you need APM (application performance monitoring) with code-level tracing, this isn't that tool. HertzBeat focuses on infrastructure monitoring — servers, databases, networks, containers. For APM, you'd pair it with something like SigNoz or Grafana Faro.
My Honest Take
After a week of running HertzBeat in production, I'm genuinely impressed. The setup was straightforward (one Docker command), the dashboard is clean and modern, and the AI anomaly detection actually works — it caught a slow PostgreSQL query I didn't even know about. 7,300+ GitHub stars and 188K Docker pulls don't lie.
The only thing that tripped me up was the initial config — I forgot to set the collector identity and spent an hour wondering why metrics weren't showing up. Pro tip: if you're using collectors, set IDENTITY and MANAGER_HOST properly from the start. Other than that? Smooth sailing.
🚀 Explore Apache HertzBeat on Run This Ai
Docker Compose configs, system requirements, installation guides, and more — all in one place.
View Apache HertzBeat Tool Page →