Apache HertzBeat Tutorial — Get Monitoring Running in 5 Minutes with Docker
Step-by-step tutorial to deploy Apache HertzBeat with Docker. Set up monitors for PostgreSQL, Redis, servers, and configure AI-powered alerts in minutes.

Get Apache HertzBeat Running in 5 Minutes — A Hands-On Tutorial
Last week I needed to monitor a production setup: 3 servers, 2 PostgreSQL databases, a Redis cluster, and a handful of microservices. I could've gone with Prometheus + Grafana + AlertManager + a dozen exporters... or I could just run one Docker command. I chose the one Docker command.
Here's exactly how I set up Apache HertzBeat, the mistakes I made along the way, and what you need to know to get it right the first time.
🚀 Want to deploy Apache HertzBeat yourself?
Docker configs, system requirements, and installation guides — all on one page.
View Apache HertzBeat Tool Page →Step 1: Quick Docker Install (This Takes 30 Seconds)
docker run -d -p 1157:1157 -p 1158:1158 \
  --name hertzbeat \
  apache/hertzbeat:latest
What the ports mean: 1157 is the web UI (you'll access this in your browser), and 1158 is the management port for collector communication. I initially only exposed 1157 and wondered why collectors couldn't connect — don't make my mistake, expose both.
Once the container is running, open http://localhost:1157 and log in with admin / hertzbeat.
⏱ Time elapsed: ~30 seconds
Step 2: Set Up Your First Monitor (2 Minutes)
Click "Add Monitor" in the dashboard. You'll see a list of 200+ monitoring templates. For this tutorial, let's monitor a PostgreSQL database:
- Search for "PostgreSQL" in the template list
- Enter your database host, port (default: 5432), and credentials
- Set the collection interval (I use 30 seconds for critical DBs, 60 seconds for dev)
- Click "Save"
If you see metrics appearing in 10 seconds: congrats, you did it right.
If you see "Connect failed": check that your PostgreSQL allows remote connections (listen_addresses = '*' in postgresql.conf) and that port 5432 is reachable from the HertzBeat container.
⏱ Time elapsed: ~2 minutes
Step 3: Set Up Intelligent Alerting (1 Minute)
This is where HertzBeat shines. Instead of writing PromQL queries for alerts, you define them visually:
- Go to "Alert Center"
- Click "Add Alert Definition"
- Pick your PostgreSQL monitor, choose the metric (e.g.,
connections_used) - Set the threshold — I use
connections_used > 80% of max_connectionsfor warning,> 95%for critical - Configure notification channel (I use Telegram)
Step 4: Add a Collector for Deep System Metrics (2 Minutes)
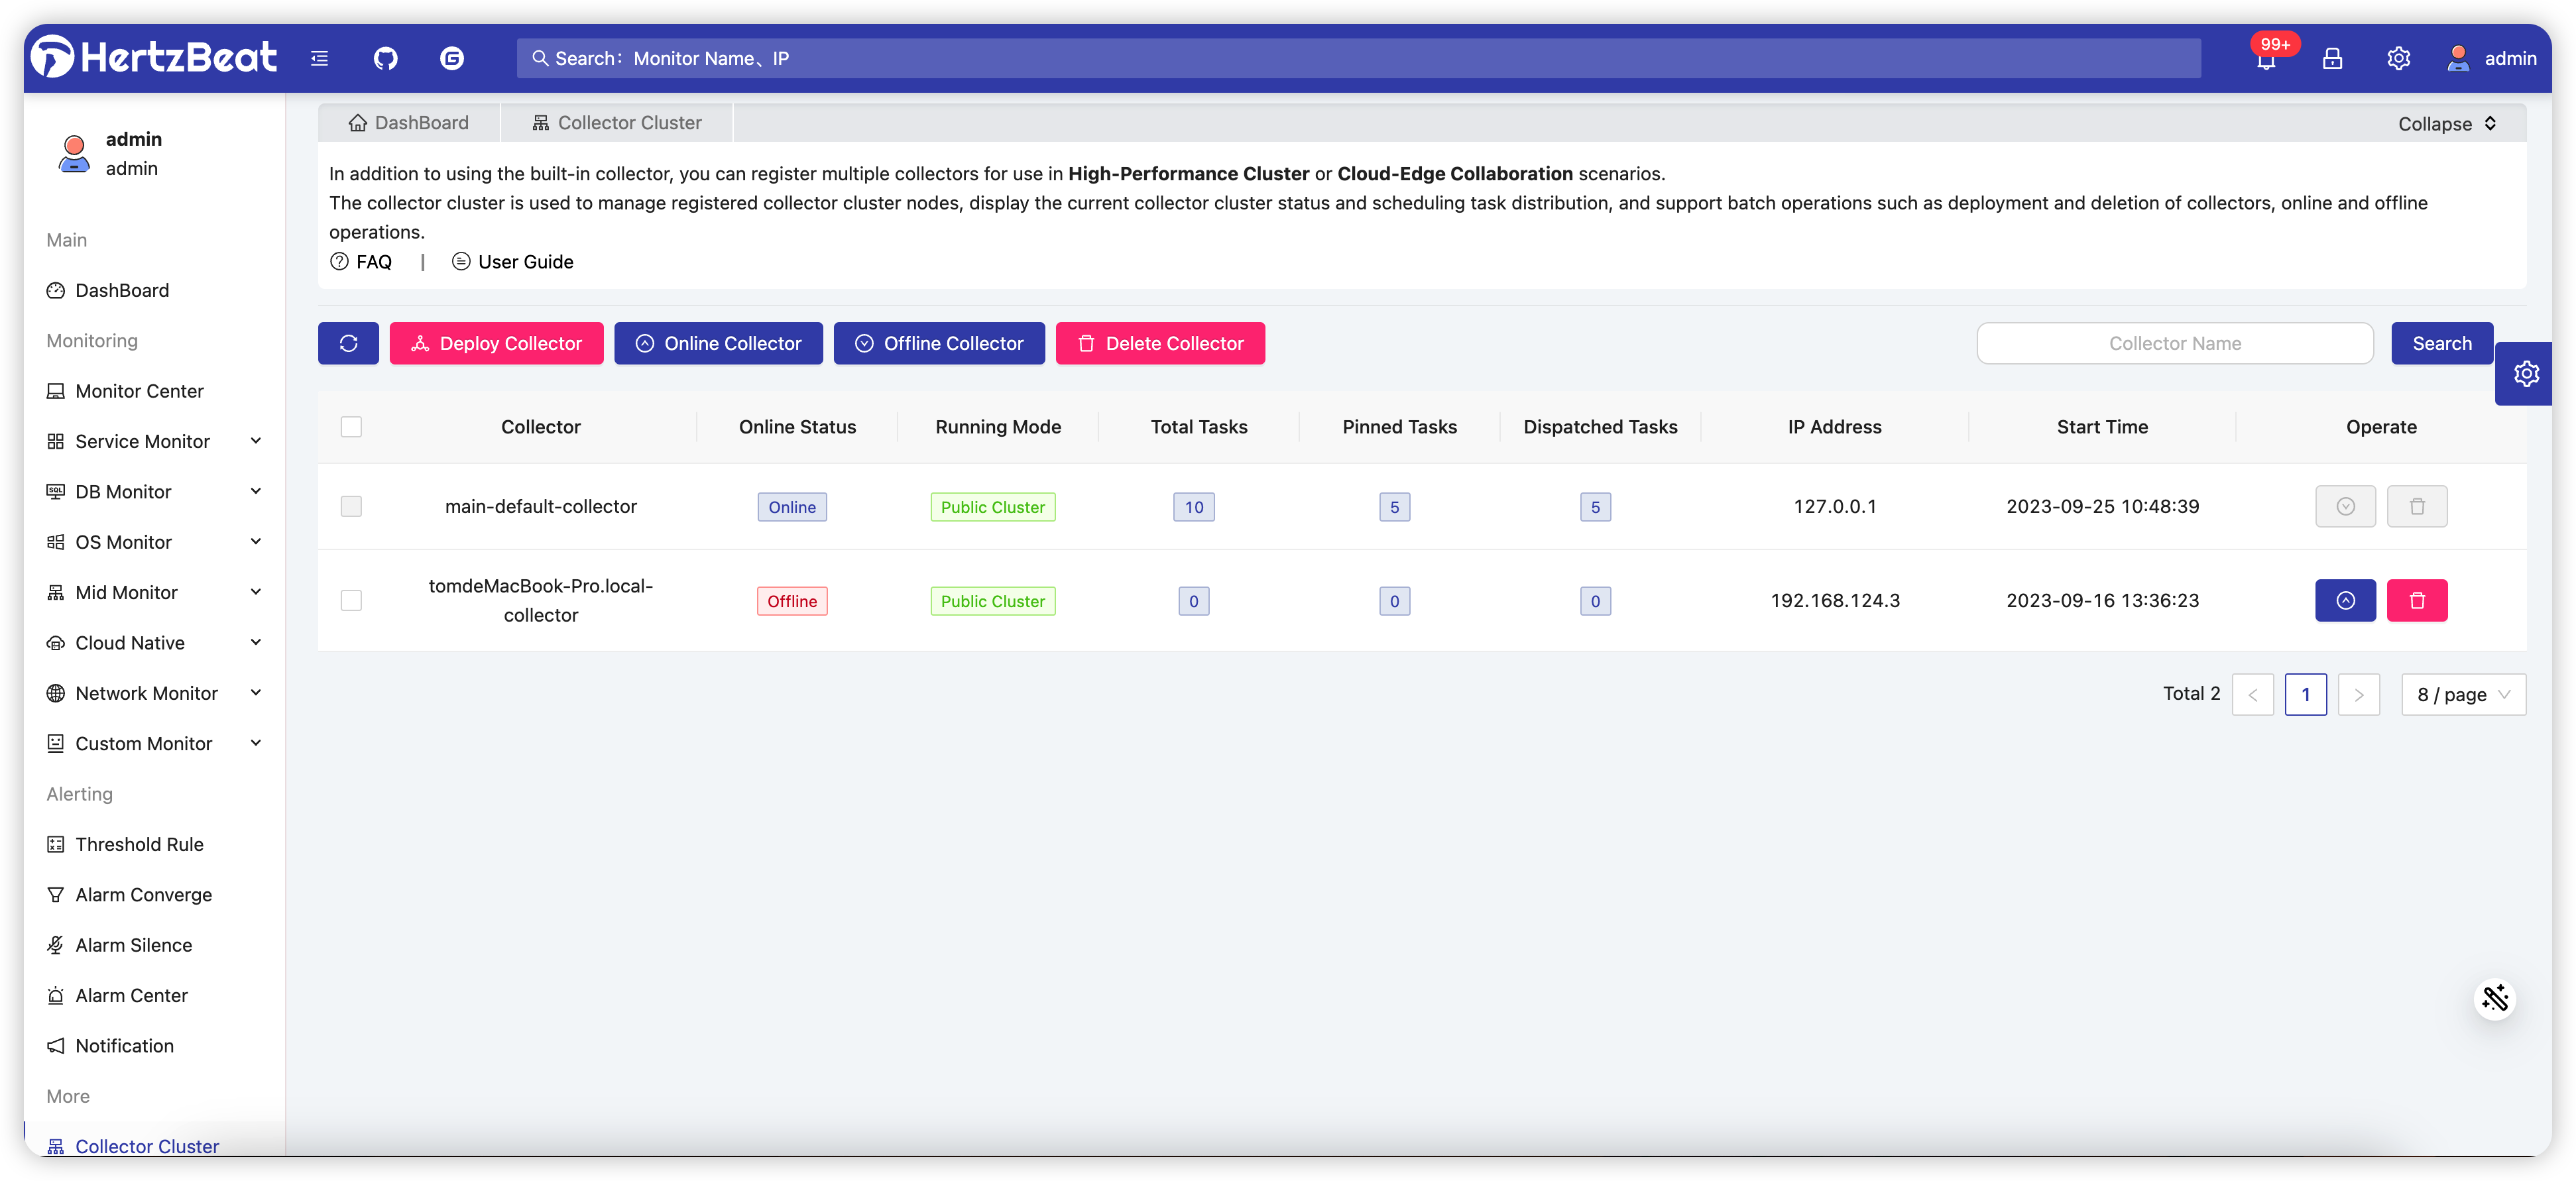
For server-level metrics (CPU, memory, disk, network), you need a collector. The collector can run on the same machine or remotely:
docker run -d \
  -e IDENTITY=my-server-1 \
  -e MANAGER_HOST=YOUR_HERTZBEAT_IP \
  -e MANAGER_PORT=1158 \
  --name hertzbeat-collector \
  apache/hertzbeat-collector:latest
⚠️ My mistake: I typed MANAGER_HOST=127.0.0.1 when the collector was on a different server. The collector needs the actual IP of the main HertzBeat server, not localhost. Lost 20 minutes on that one.
⏱ Time elapsed: ~5 minutes total
Comparison: HertzBeat vs Other Monitoring Tools
| Feature | HertzBeat | Prometheus | Nagios | Datadog |
|---|---|---|---|---|
| Setup Time | 2 min (Docker) | 30 min | 1 hour | 10 min |
| AI Anomaly Detection | ✅ Built-in | ❌ Manual | ❌ No | ✅ Paid add-on |
| 200+ Templates | ✅ Yes | ✅ Yes | ✅ Yes | ✅ Yes |
| Agentless Mode | ✅ Yes | ❌ No | ❌ No | ✅ Agent |
| Visual Topology | ✅ Yes | ❌ No | ❌ No | ❌ No |
| Cost | Free & Open Source | Free | Free | $$$ |
| Multi-DB Support | 6 TSDBs | Prometheus only | RRD | Proprietary |
What I Learned Running HertzBeat for a Week
The good: It's fast. The dashboard loaded in under a second even with 20+ monitors. The AI anomaly detection caught a slow query on our production DB that I had no idea about. Alert fatigue dropped significantly after I set up intelligent grouping.
The annoying: The documentation is solid but scattered across multiple pages. I had to jump between the quickstart, the Docker deploy guide, and the collector guide to get everything working. Not a dealbreaker, but a unified getting-started guide would help.
The ugly: My own config mistakes. If I could go back, I'd read the environment variables carefully before starting. IDENTITY, MANAGER_HOST, MODE — they all matter.
Final Verdict
HertzBeat is a serious contender for anyone who needs infrastructure monitoring without the complexity tax. One Docker command, 200+ templates, AI-powered alerts, and full Apache governance. For a self-hosted monitoring stack, it's hard to beat.
🚀 Explore Apache HertzBeat on Run This Ai
Docker Compose configs, system requirements, installation guides, and more — all in one place.
View Apache HertzBeat Tool Page →