Getting Started with Pulse: Docker Setup, AI Patrols, and Real-World Monitoring Tutorial
A step-by-step tutorial for setting up Pulse monitoring with Docker — connecting Proxmox, TrueNAS, Docker hosts, and setting up AI patrols that detect silent failures automatically.

🧪 Getting Started with Pulse: A Practical Tutorial
Alright, let's cut the theory and get Pulse running on your infrastructure. I'll walk you through setting it up with Docker, connecting it to your first few systems (Proxmox and Docker), and showing you what the AI patrols look like in action. The whole thing should take about 20 minutes — grab a coffee.
🚀 Want to deploy Pulse yourself?
Docker Compose configs, system requirements, and installation guides — all on one page.
View Pulse Tool Page →Step 1: Deploy Pulse with Docker
I chose port 3000 here to avoid conflicts — Pulse defaults to 8080 internally, so pick whatever host port you prefer. The /data mount is critical: Pulse stores its database and configuration there. Forget the volume and you'll lose everything on container restart. Ask me how I learned this. (Spoiler: the hard way.)
docker run -d \
  --name pulse \
  -p 3000:8080 \
  -v $(pwd)/pulse-data:/data \
  --restart unless-stopped \
  rcourtman/pulse:latest
If you see the container starting, give it about 30 seconds. Pulse's first boot creates the SQLite database and runs migrations. You'll know it's ready when:
docker logs pulse --tail 5
# Expected output: "Listening on port 8080"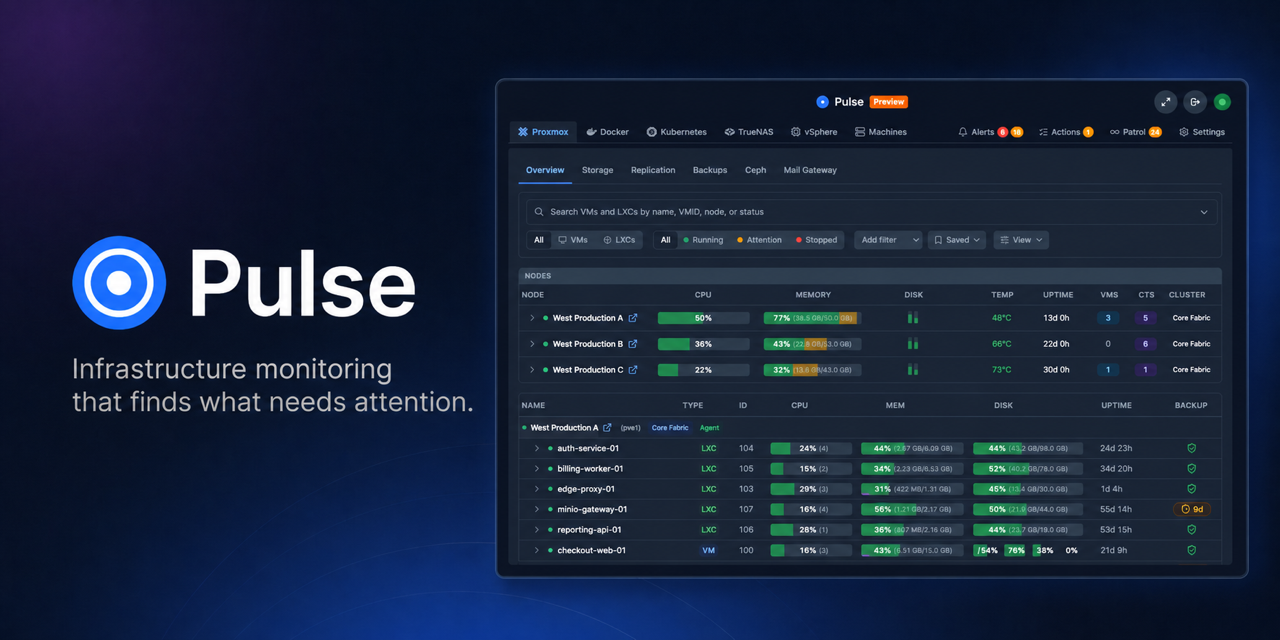
Step 2: First Login and Initial Setup
Open http://your-server:3000 in your browser. You'll see Pulse's dashboard — initially empty. The first thing it asks for is to create an admin account. Important: use a real email if you want push notifications later. I used a burner email and regretted it when I had to redo the setup to get mobile alerts working.
Once logged in, head to Settings → Integrations. This is where the magic happens — you add your infrastructure targets. Pulse supports a surprising number of connection methods:
- Proxmox: Just your PVE host IP and API token
- Docker: Socket path or TCP connection
- Kubernetes: Kubeconfig file upload
- TrueNAS: API key + host
- vSphere: vCenter credentials
Connecting Docker (The Fastest Test)
This is the quickest way to see Pulse in action. In Integrations, pick Docker. If Pulse is running on the same host as Docker, use the default socket path:
/var/run/docker.sockPulse will immediately scan all running containers. I connected my Docker socket and within 15 seconds Pulse had discovered 12 containers — including itself, which made me chuckle. It showed CPU, memory, network I/O, and restart counts for each one. Right there in the dashboard I could see that my Plex container had been restarted three times that day — a problem I hadn't noticed because Plex "seemed fine."
Step 3: Setting Up Your First AI Patrol
This is the feature that sets Pulse apart. Go to Patrols → New Patrol. You'll see options for different patrol types:
- Silent Failure Patrol: Monitors services for unresponsive states that don't trigger alerts
- Backup Health Patrol: Checks if backups completed successfully and within expected timeframes
- Resource Drift Patrol: Tracks gradual resource changes (disk filling, memory creep)
- Docker Health Patrol: Monitors container restart counts and health checks
I set up a Backup Health Patrol for my Proxmox host. The configuration is straightforward: point it at the integration, set a schedule, and choose how often to check. Within 10 minutes of enabling it, Pulse had already run a patrol cycle and showed a clean bill of health on my last three backup jobs. That was oddly satisfying.
Step 4: Understanding the Storage View
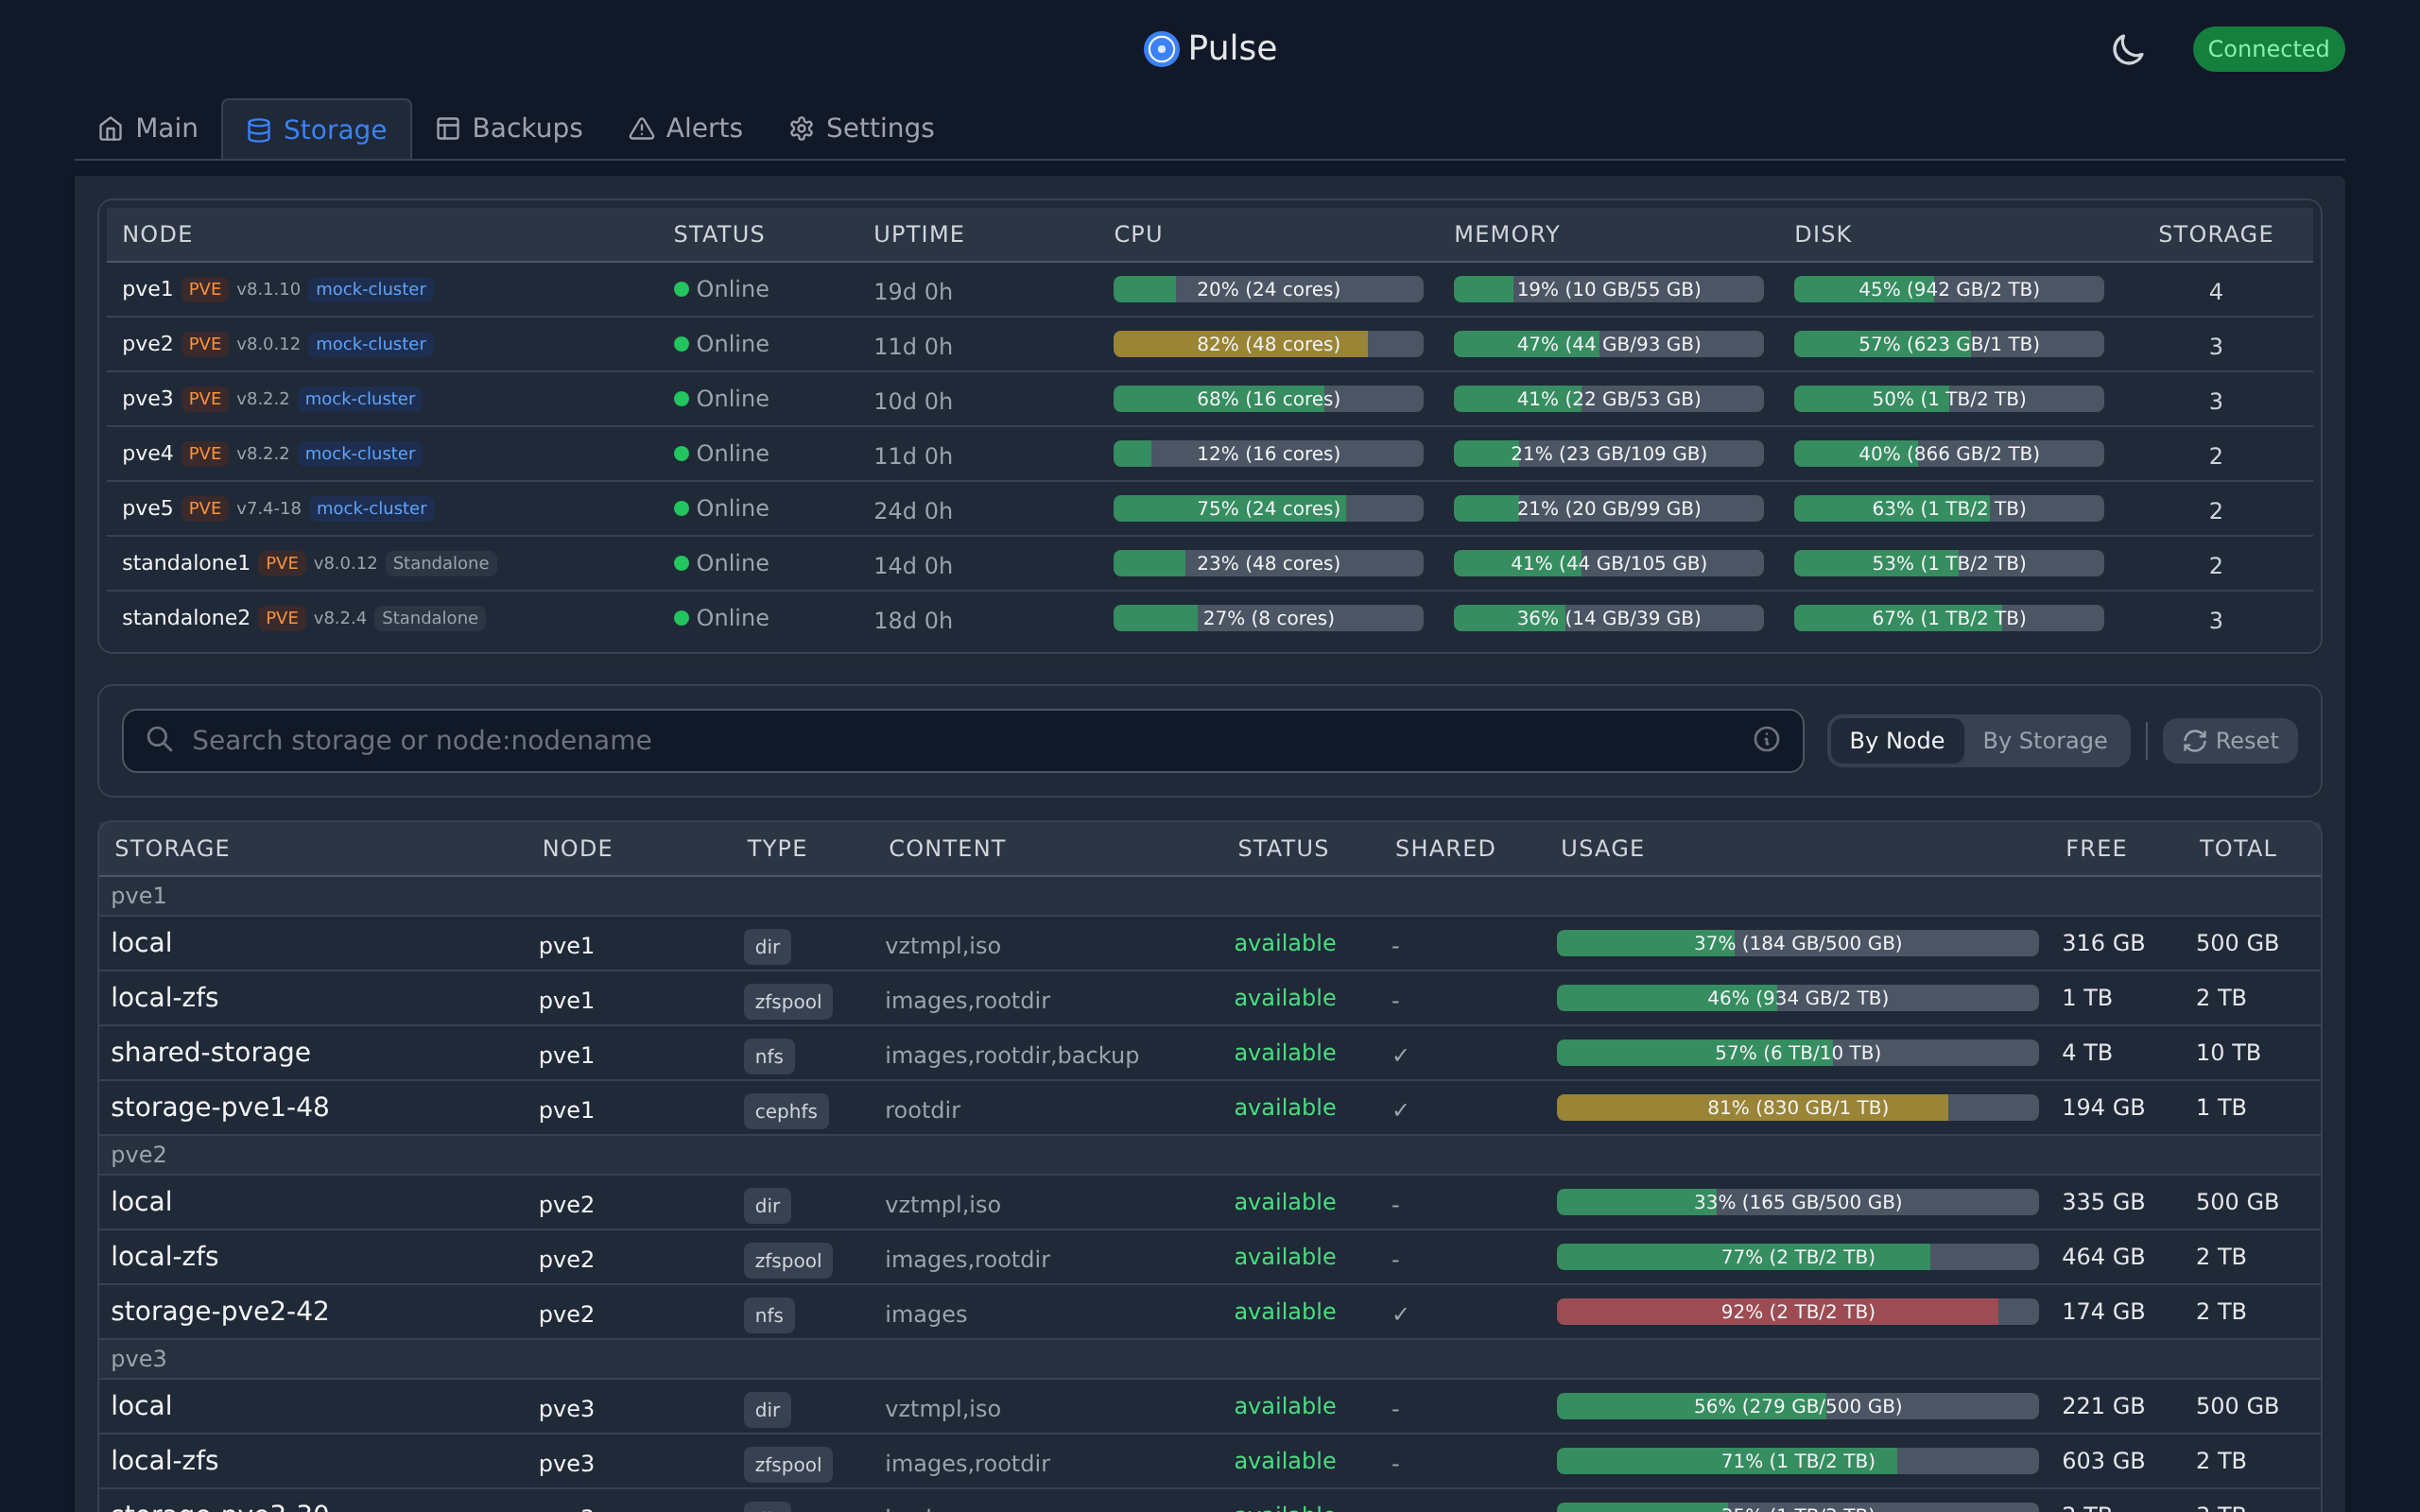
One thing Pulse does really well is storage monitoring. The screenshot above shows the storage view — it gives you per-datastore metrics: total, used, available, and — crucially — trend data. I caught a VM log file that was growing at 2GB/day because Pulse showed me the 7-day trend. Without it, I'd have found out when the datastore hit 100% at 3 AM on a Saturday.
Step 5: Checking Alert History
The alert history view keeps a log of every patrol finding, including automatic fixes that Pulse applied. This is worth checking regularly because it shows you what Pulse is catching silently:
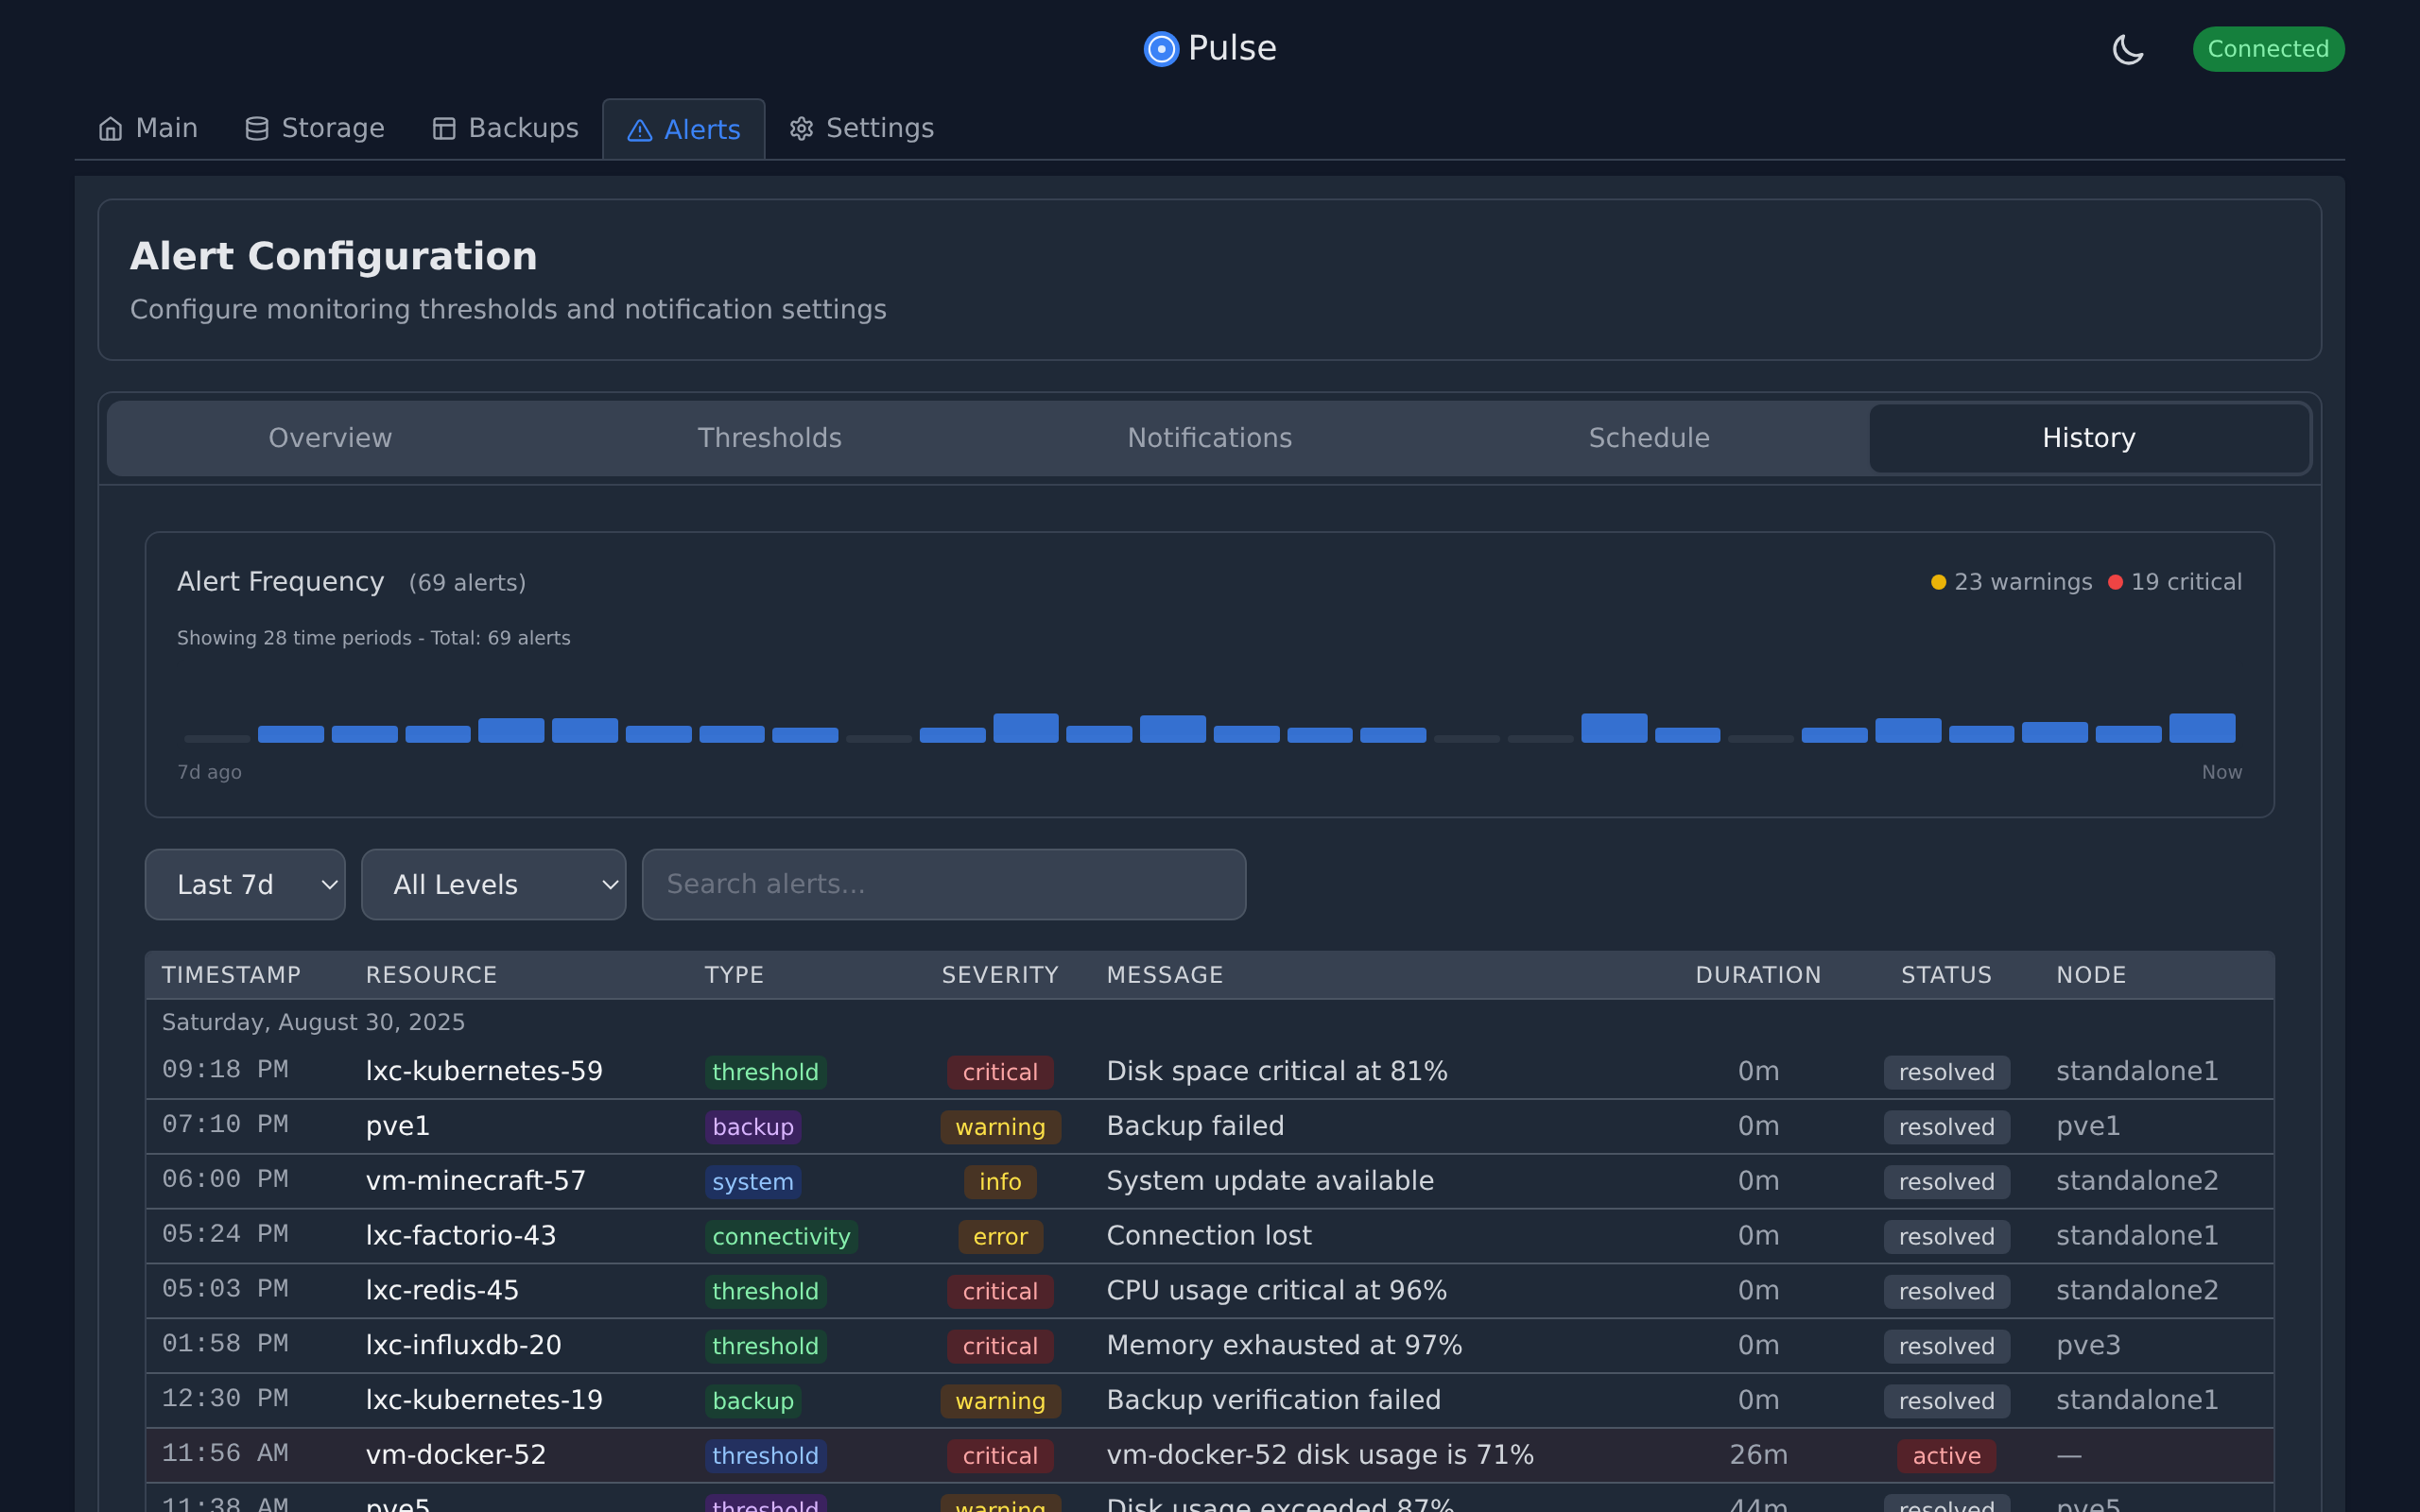
In my first 48 hours, Pulse logged: 3 container restarts it triggered automatically, 1 Proxmox backup that took longer than expected (flagged, not fixed — backup verification requires manual intervention), and 2 NFS mount checks that passed. The auto-fix for containers is brilliant: Pulse detected an unresponsive container, restarted it, confirmed the container came back healthy, and logged the entire sequence. Compare that to traditional monitoring where you'd get an alert at 3 AM and have to SSH in to restart it yourself.
Performance Notes (Real Numbers)
I ran Pulse on a modest VM (2 vCPU, 4GB RAM) monitoring 4 Docker hosts and 1 Proxmox cluster. Here's what I saw:
- Idle memory: ~180MB — surprisingly light
- CPU: 2-5% during patrol runs, <1% idle
- Cold start: ~25 seconds (migrations + initial scan)
- Docker container discovery: ~8 seconds per 50 containers
Final Thoughts
Pulse surprised me. I went in expecting another monitoring dashboard but found something genuinely different — an AI copilot that actually reduces operational overhead instead of adding to it. The silent failure patrol alone is worth the setup time. Give it a try on a non-critical host first — I think you'll be as impressed as I was.
🚀 Explore Pulse on Run This Ai
Docker Compose configs, system requirements, installation guides, and more — all in one place.
View Pulse Tool Page →