How to Self-Host HyperDX: A Complete Guide to Open-Source Observability
Learn how to deploy and configure HyperDX, the open-source observability platform that unifies logs, metrics, traces, session replays, and errors on ClickHouse.
🚀 Want to deploy HyperDX yourself?
Docker configs, system requirements, and installation guides — all on one page.
View HyperDX Tool Page →Modern applications generate vast amounts of telemetry data — logs, metrics, traces, session replays, and error reports. Managing and correlating all these signals typically requires multiple tools, each with its own setup and query language. HyperDX changes that by providing a unified open-source observability platform built on the rock-solid foundation of ClickHouse and OpenTelemetry.
What is HyperDX?
HyperDX is an all-in-one observability solution that brings together session replays, logs, metrics, traces, and errors in a single, searchable interface. With over 9,600 GitHub stars and 222K+ Docker pulls, it has quickly become a go-to choice for teams looking for a modern, self-hosted alternative to Datadog, New Relic, or Grafana stacks.
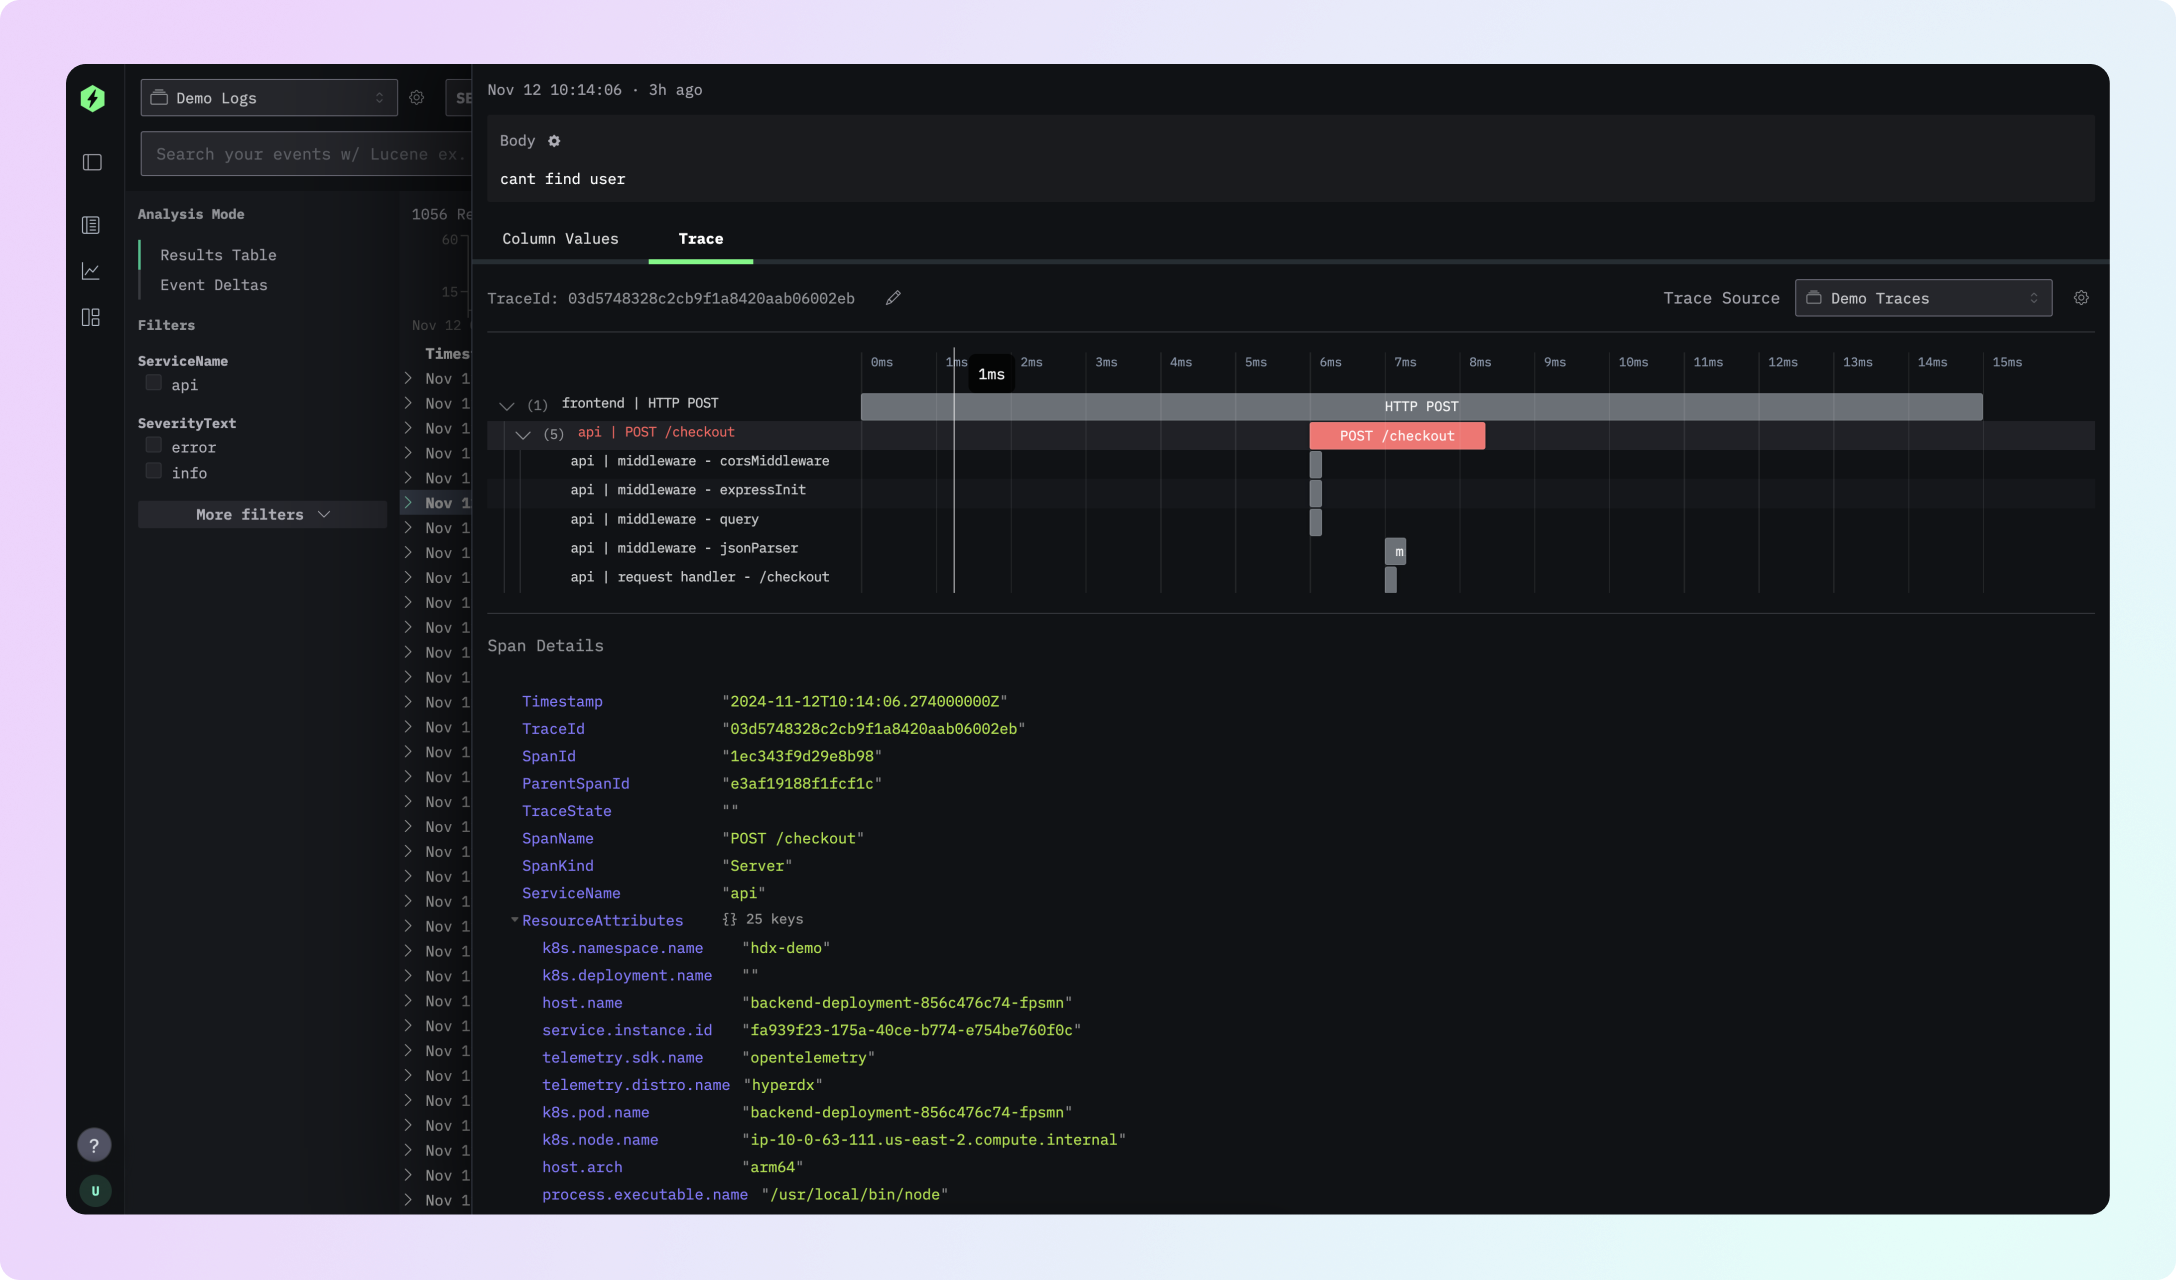
Key Features
| 🔍 Unified Search | Search across logs, traces, and session replays with full-text and property-based syntax (e.g. level:err) |
| ⚡ Blazing Speed | Optimized for ClickHouse — searches complete in milliseconds even across terabytes of data |
| 📊 Dashboards | Create high-cardinality dashboards without complex queries or pre-aggregation |
| 🔔 Alerts | Set up real-time alerts on any metric or log pattern in just a few clicks |
| 🕵️ Session Replay | Watch exactly what users experienced leading up to errors and issues |
| 🔭 OpenTelemetry | Native OTel support — instrument once, send everywhere |
| 🏗️ APM | Monitor HTTP requests, DB queries, and service health end-to-end |
Architecture Overview
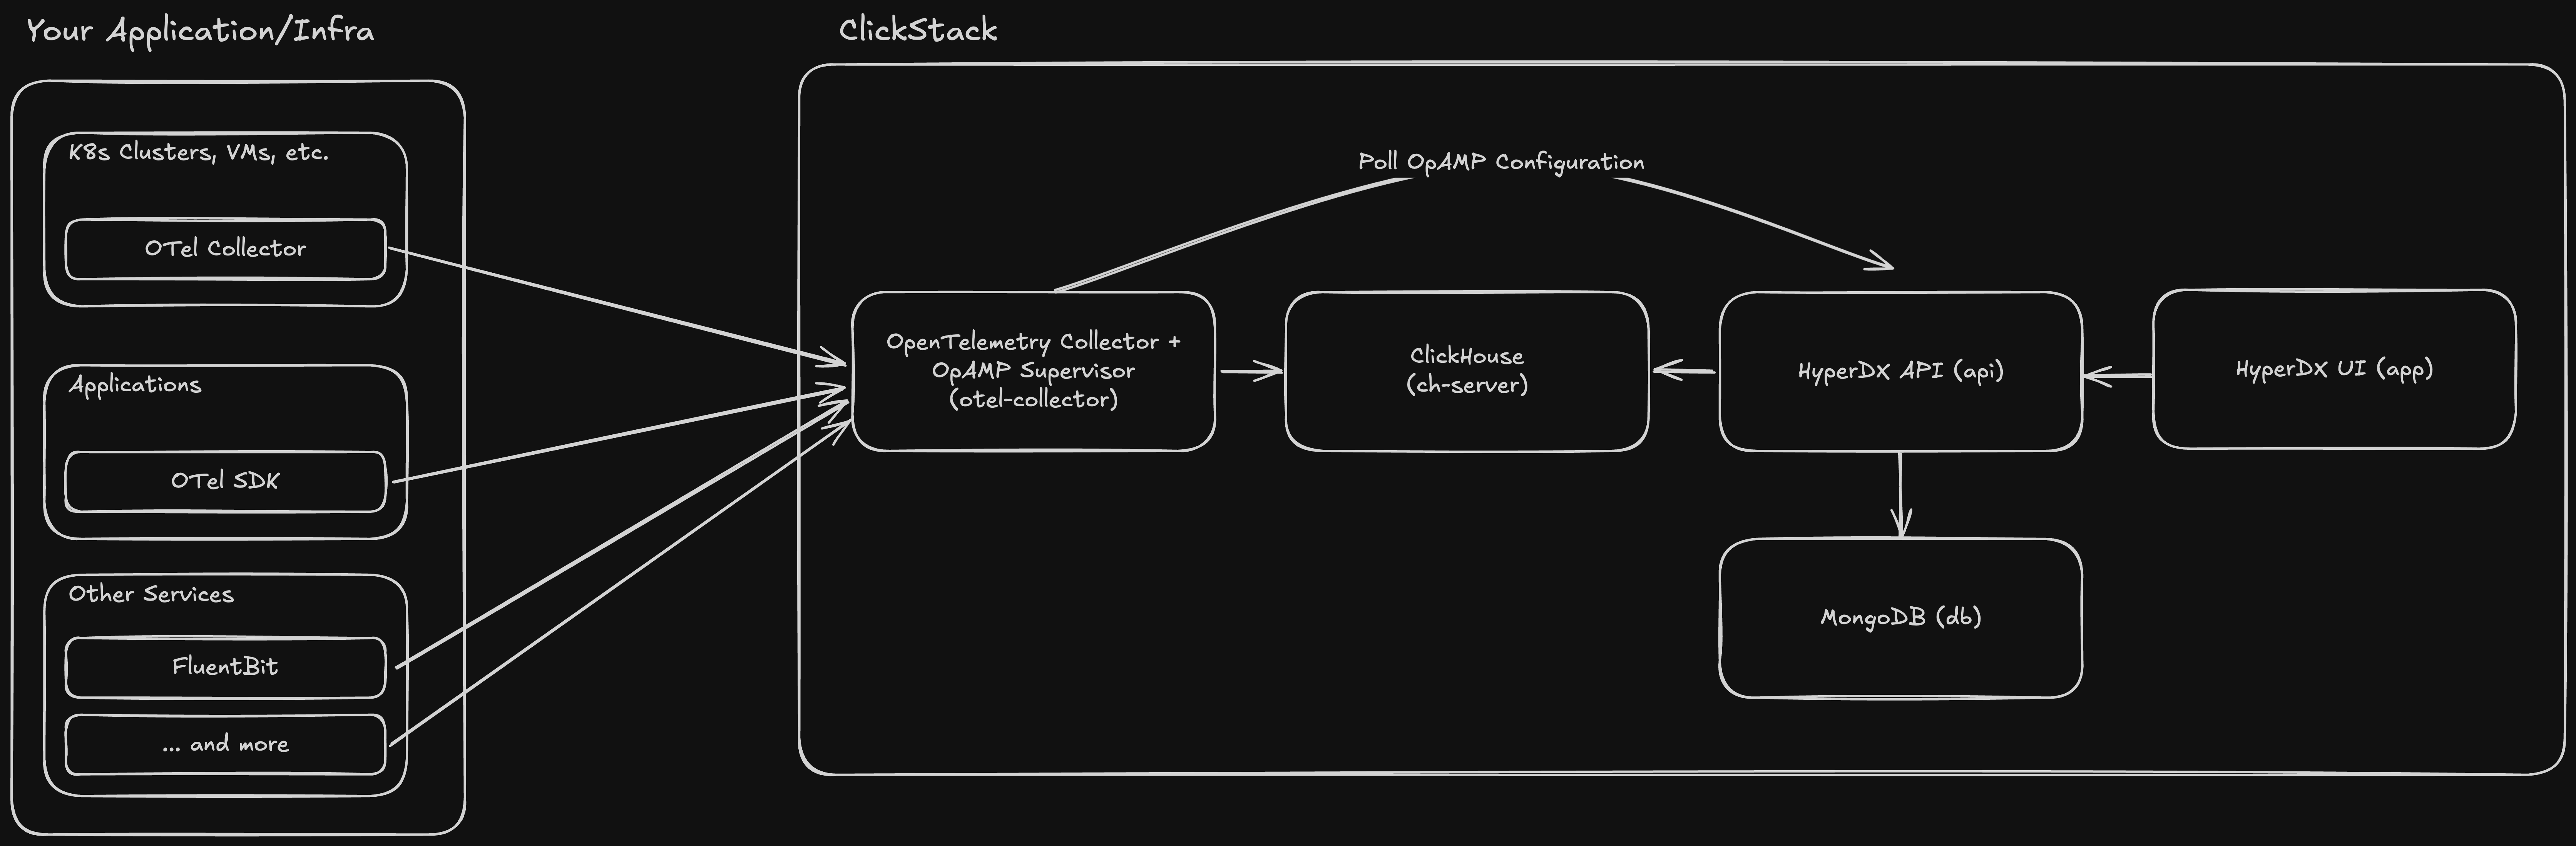
HyperDX uses a simple but powerful architecture. Data flows from your instrumented applications through OpenTelemetry collectors into HyperDX, which stores everything in ClickHouse. The web UI provides a single pane of glass for all observability data.
Getting Started
Deploying HyperDX is remarkably simple. The fastest way to try it is with Docker:
docker run -p 8080:8080 -p 4317:4317 -p 4318:4318 \
  docker.hyperdx.io/hyperdx/hyperdx-all-in-one
After starting, visit http://localhost:8080 to access the HyperDX UI. The single container includes ClickHouse, the HyperDX server, and an OpenTelemetry Collector — everything you need to get started.
Self-Hosting Requirements
- Minimum: 2 CPU cores, 4 GB RAM
- Recommended: 4 CPU cores, 8 GB RAM
- Storage: SSD recommended, depends on data volume
- Docker: Latest stable Docker and Docker Compose
Why Choose HyperDX?
Traditional observability stacks require juggling Elasticsearch (or Loki) for logs, Jaeger for traces, Prometheus for metrics, and Sentry for errors. HyperDX replaces this complexity with a single platform. It's schema-agnostic, works with any ClickHouse cluster, and offers intuitive search that doesn't force you to learn SQL or PromQL.
For teams already using ClickHouse, HyperDX is a natural addition. It integrates directly with existing ClickHouse deployments and provides Kibana-like visualization capabilities optimized for ClickHouse's columnar engine.
🚀 Ready to simplify your observability stack?
Get the full Docker configuration, system requirements, and deployment guide.
View HyperDX Tool Page →